 Back
BackPosition-Time Graphs for an RC Car: Interpreting Motion Diagrams
Study Guide - Smart Notes
 Tailored notes based on your materials, expanded with key definitions, examples, and context.
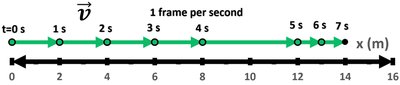
Q11. An RC car is in motion, and the photographer uses the burst mode photo feature to capture the moving subject. He took one frame per second. The given figure shows the motion diagram of the RC car. Draw its position-versus-time graph.
Background
Topic: Position-Time Graphs in Kinematics
This question tests your ability to interpret a motion diagram and translate it into a position-versus-time graph. Understanding how the position of an object changes with time is a fundamental concept in kinematics, which is a key topic in introductory physics and mathematical modeling of motion.
Key Terms and Concepts:
Position: The location of an object at a particular time, usually measured from a reference point.
Time Interval: The difference in time between two events (here, each frame is 1 second apart).
Uniform Motion: When an object moves equal distances in equal intervals of time, its position-time graph is a straight line.
Position-Time Graph: A graph that plots position (vertical axis) versus time (horizontal axis).
Step-by-Step Guidance
Examine the motion diagram and note the position of the RC car at each second. Each dot represents the car's position at a specific time (0 s, 1 s, 2 s, etc.).
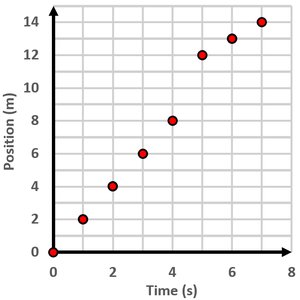
Record the position values (in meters) for each second from the diagram. For example, at t = 0 s, x = 0 m; at t = 1 s, x = 2 m; and so on.
Plot these position values on a graph, with time (in seconds) on the horizontal axis and position (in meters) on the vertical axis.
Connect the points in the order of increasing time. Observe whether the points form a straight line or a curve. A straight line indicates constant velocity, while a curve indicates changing velocity.
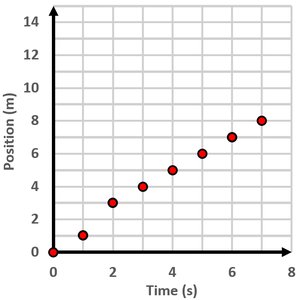
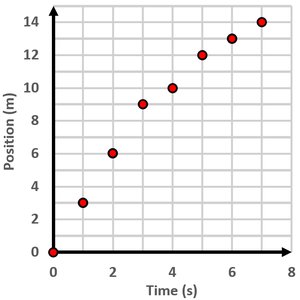
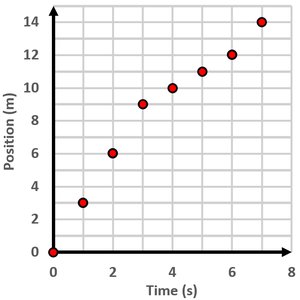
Compare the plotted graph to the provided options. Look for the graph where the position increases by the same amount each second, reflecting the uniform motion shown in the diagram.
Try solving on your own before revealing the answer!
Final Answer: Option A (Image 3)
The correct position-versus-time graph is the one where the position increases linearly with time, indicating constant velocity. This matches the uniform spacing in the motion diagram and the straight line in the graph shown in Image 3.
This graph shows that the RC car moves equal distances in equal time intervals, which is consistent with the motion diagram provided.
