Skip to main content
Introduction to Chemistry
My Course
Learn
Exam Prep
AI Tutor
Study Guides
Flashcards
Explore
Try the app
My Course
Learn
Exam Prep
AI Tutor
Study Guides
Flashcards
Explore
Try the app
Back
Heating and Cooling Curves definitions
You can tap to flip the card.
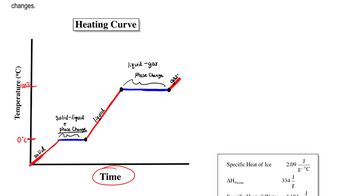
Heating Curve
You can tap to flip the card.
👆
Heating Curve
Graph showing temperature increase and phase transitions as heat is absorbed by a substance over time.
Track progress
Control buttons has been changed to "navigation" mode.
1/15
Related flashcards
Related practice
Recommended videos
Heating and Cooling Curves quiz
Heating and Cooling Curves
15 Terms
Heating and Cooling Curves
12. Liquids, Solids, and Intermolecular Forces
5 problems
Topic
Atomic, Ionic and Molecular Solids
12. Liquids, Solids, and Intermolecular Forces
5 problems
Topic
12. Liquids, Solids, and Intermolecular Forces
4 topics
12 problems
Chapter
Guided course
05:54
The Cooling Curve
5
views
Guided course
09:10
Heating and Cooling Curves
4
views
Guided course
09:03
The Heating Curve
5
views
1
rank
Terms in this set (15)
Hide definitions
Heating Curve
Graph showing temperature increase and phase transitions as heat is absorbed by a substance over time.
Cooling Curve
Graph depicting temperature decrease and phase transitions as heat is released from a substance over time.
Phase Change
Process where a substance transitions between solid, liquid, and gas, with temperature remaining constant.
Melting Point
Specific temperature where a solid becomes a liquid, such as 0°C for water.
Boiling Point
Specific temperature where a liquid becomes a gas, such as 100°C for water.
Specific Heat
Amount of heat required to raise the temperature of one gram of a substance by one degree Celsius.
Potential Energy
Stored energy related to the arrangement or state of particles, increasing during phase changes.
Kinetic Energy
Energy associated with particle motion, directly linked to temperature changes.
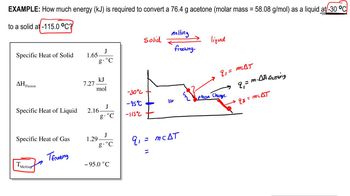
q = mcΔT
Equation used to calculate heat absorbed or released during temperature changes, involving mass, specific heat, and temperature change.
q = mΔH
Equation used to calculate heat absorbed or released during phase changes, involving mass and enthalpy change.
Enthalpy Change
Amount of heat absorbed or released during a phase transition, represented as ΔH.
Fusion
Phase transition from solid to liquid, also known as melting, requiring energy absorption.
Vaporization
Phase transition from liquid to gas, requiring significant energy to separate particles.
Condensation
Phase transition from gas to liquid, releasing energy as particles come closer together.
Exothermic Process
Process where heat is released, resulting traditionally in negative q values and bond formation.
 BackBack
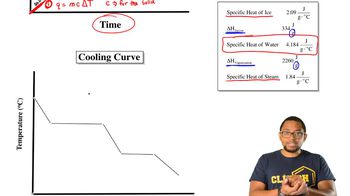
 05:54
05:54