Ch. 5 - Systems and Matrices
Lial - College Algebra 13th Edition
Lial13th EditionCollege AlgebraISBN: 9780136881063Not the one you use?Change textbook
Chapter 6, Problem 65

Graph the solution set of each system of inequalities.
ylogxy\(\le\]\log\) x
yx2y\(\ge\]\left\)|x-2\(\right\)|

Verified step by step guidance
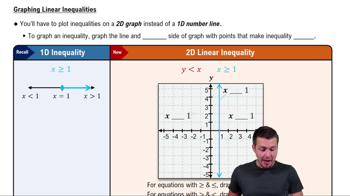
1
Identify the domain and shape of each inequality. For the first inequality, \(y \leq \log x\), note that the logarithm function \(\log x\) is defined only for \(x > 0\). The graph of \(y = \log x\) is a curve increasing slowly and passing through the point \((1,0)\).
For the second inequality, \(y \geq |x - 2|\), recognize that \(y = |x - 2|\) is a V-shaped graph with its vertex at \((2,0)\). The inequality \(y \geq |x - 2|\) means the solution includes the region on or above this V-shaped graph.
Graph the boundary lines first: plot \(y = \log x\) for \(x > 0\) and \(y = |x - 2|\) for all real \(x\). Use a solid line for both since the inequalities include equality (\(\leq\) and \(\geq\)).
Determine the solution regions for each inequality separately. For \(y \leq \log x\), shade the region below or on the curve \(y = \log x\). For \(y \geq |x - 2|\), shade the region above or on the V-shaped graph.
Find the intersection of the two shaded regions from the previous step. The solution set of the system is where both shaded regions overlap. This overlapping region satisfies both inequalities simultaneously.

Verified video answer for a similar problem:

This video solution was recommended by our tutors as helpful for the problem above.
Video duration:
10m
Was this helpful?

Key Concepts

Here are the essential concepts you must grasp in order to answer the question correctly.

Graphing Inequalities

Graphing inequalities involves shading the region of the coordinate plane that satisfies the inequality. For example, y ≤ f(x) means shading all points on or below the curve y = f(x). Understanding how to represent inequalities graphically helps visualize solution sets for systems of inequalities.
Recommended video:
Guided course
7:02
Linear Inequalities

Logarithmic Functions

A logarithmic function, such as y = log x, is the inverse of an exponential function. It is defined only for x > 0 and has a characteristic curve that increases slowly and passes through (1,0). Knowing its domain and shape is essential for correctly graphing inequalities involving logarithms.
Recommended video:
5:26
Graphs of Logarithmic Functions

Absolute Value Functions

The absolute value function y = |x - a| creates a V-shaped graph with its vertex at (a, 0). It outputs the distance of x from a, always non-negative. When graphing inequalities like y ≥ |x - 2|, the solution includes points on or above this V-shaped graph.
Recommended video:
4:56
Function Composition