Textbook Question
Answer each question. A line passes through the points of intersection of the graphs of y = x2 and x2 + y2 = 90. What is the equation of this line?

 Verified step by step guidance
 06:07
06:07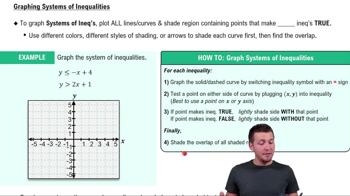 6:19
6:19 6:13
6:13Answer each question. A line passes through the points of intersection of the graphs of y = x2 and x2 + y2 = 90. What is the equation of this line?
Use Cramer's rule to solve each system of equations. If D = 0, then use another method to determine the solution set. See Examples 5–7.
4x + 3y = -7
2x + 3y = -11
Solve each problem. Find the radius and height (to the nearest thousandth) of an open-ended cylinder with volume 50 in.3 and lateral surface area 65 in.2.
Graph the solution set of each system of inequalities.
Use Cramer's rule to solve each system of equations. If D = 0, then use another method to determine the solution set. See Examples 5–7.
Find each product, if possible.