Textbook Question
The graph of a function ƒ is shown in the figure. Sketch the graph of each function defined as follows.
(c) y = ƒ(x+3) - 2


 Verified step by step guidance
 5:34
5:34 5:31
5:31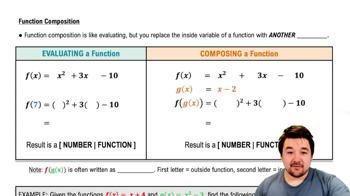 4:56
4:56The graph of a function ƒ is shown in the figure. Sketch the graph of each function defined as follows.
(c) y = ƒ(x+3) - 2
Let and . Find each of the following.
The graph of a function ƒ is shown in the figure. Sketch the graph of each function defined as follows.
(a) y = ƒ(x) +3
Each of the following graphs is obtained from the graph of ƒ(x)=|x| or g(x)=√x by applying several of the transformations discussed in this section. Describe the transformations and give an equation for the graph.
Let ƒ(x) = 3x -4. Find an equation for each reflection of the graph of ƒ(x). across the y-axis
The graph of a function ƒ is shown in the figure. Sketch the graph of each function defined as follows.
(d) y = |ƒ(x)|