Textbook Question
In Exercises 47–52, solve each system by the method of your choice.
1
views

 Verified step by step guidance
 5:18
5:18 06:07
06:07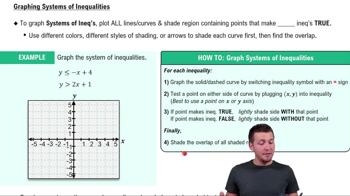 6:19
6:19In Exercises 47–52, solve each system by the method of your choice.
In Exercises 39–45, graph each inequality. y ≤ 2^x
In Exercises 47–48, solve each system by the method of your choice. (x + 2)/2 - (y + 4)/3 = 3 (x + y)/5 = (x - y)/2 - 5/2
In Exercises 46–55, graph the solution set of each system of inequalities or indicate that the system has no solution.
This
is a piecewise function. Refer to the textbook.
Perform each long division and write the partial fraction decomposition of the remainder term. (x4-x2+2)/(x3-x2)
In Exercises 46–55, graph the solution set of each system of inequalities or indicate that the system has no solution.
This
is a piecewise function. Refer to the textbook.