Textbook Question
Find k so that 4x+3 is a factor of 20x^3+23x^2-10x+k.
2
views

 Verified step by step guidance
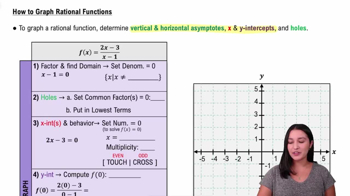
 8:19
8:19 02:58
02:58 7:02
7:02In Exercises 69–74, solve each inequality and graph the solution set on a real number line. (x + 3)/(x - 4) ≤ 5
In Exercises 71–72, use the graph of the polynomial function to solve each inequality.
2x3 + 11x2 < 7x + 6
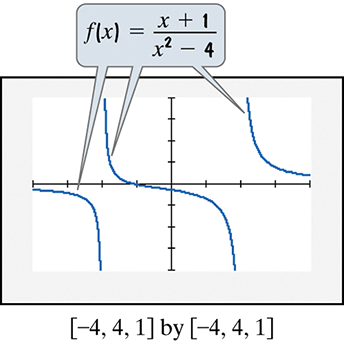
In Exercises 73–74, use the graph of the rational function to solve each inequality.
1/4(x + 2) ≤ - 3/4(x - 2)
Follow the seven steps to graph each rational function. f(x)=x4/(x2+2)
In Exercises 57–80, follow the seven steps to graph each rational function. f(x)=(x−2)/(x2−4)