Write a polynomial that represents the length of each rectangle. Transcription: The area of the rectangle is 0.5x3 - 0.3x2 + 0.22x + 0.06 square units and its width is x + 0.2 units
Ch. 3 - Polynomial and Rational Functions

Chapter 4, Problem 53
Exercises 53–60 show incomplete graphs of given polynomial functions. a) Find all the zeros of each function. b) Without using a graphing utility, draw a complete graph of the function. f(x)=−x3+x2+16x−16
Verified step by step guidance1
Identify the polynomial function given: .
To find the zeros of the function, set and solve the cubic equation .
Look for rational roots using the Rational Root Theorem, which suggests testing factors of the constant term (±1, ±2, ±4, ±8, ±16) as possible zeros.
Use synthetic division or polynomial division to test each candidate root. When a root is found, factor it out to reduce the cubic to a quadratic.
Solve the resulting quadratic equation using factoring, completing the square, or the quadratic formula to find the remaining zeros. These zeros will help in sketching the complete graph.

Verified video answer for a similar problem:
This video solution was recommended by our tutors as helpful for the problem above.
Video duration:
6mKey Concepts
Here are the essential concepts you must grasp in order to answer the question correctly.
Finding Zeros of Polynomial Functions
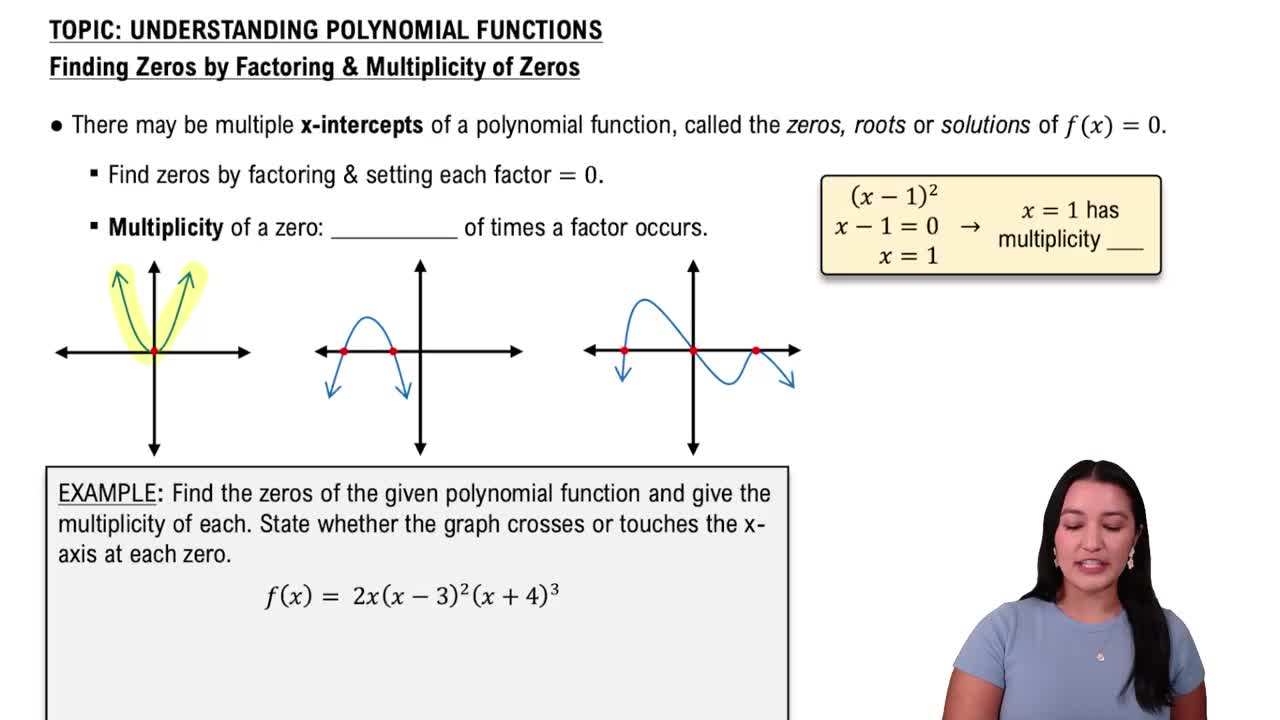
Zeros of a polynomial are the values of x for which the function equals zero. To find them, set f(x) = 0 and solve the resulting equation using factoring, synthetic division, or the Rational Root Theorem. These zeros correspond to the x-intercepts of the graph.
Recommended video:
Finding Zeros & Their Multiplicity
Polynomial Function Behavior and End Behavior
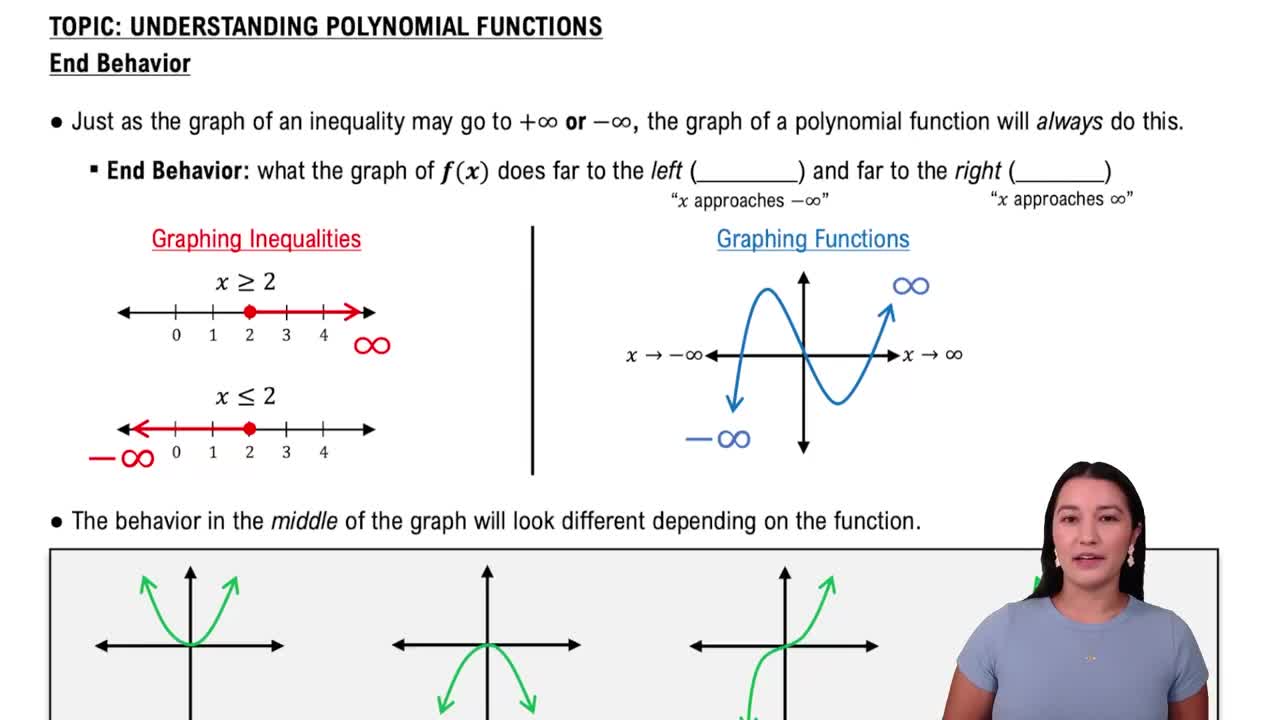
The degree and leading coefficient of a polynomial determine its end behavior, or how the graph behaves as x approaches positive or negative infinity. For example, a cubic with a negative leading coefficient falls to the right and rises to the left, guiding the overall shape of the graph.
Recommended video:
End Behavior of Polynomial Functions
Sketching Polynomial Graphs Without Technology
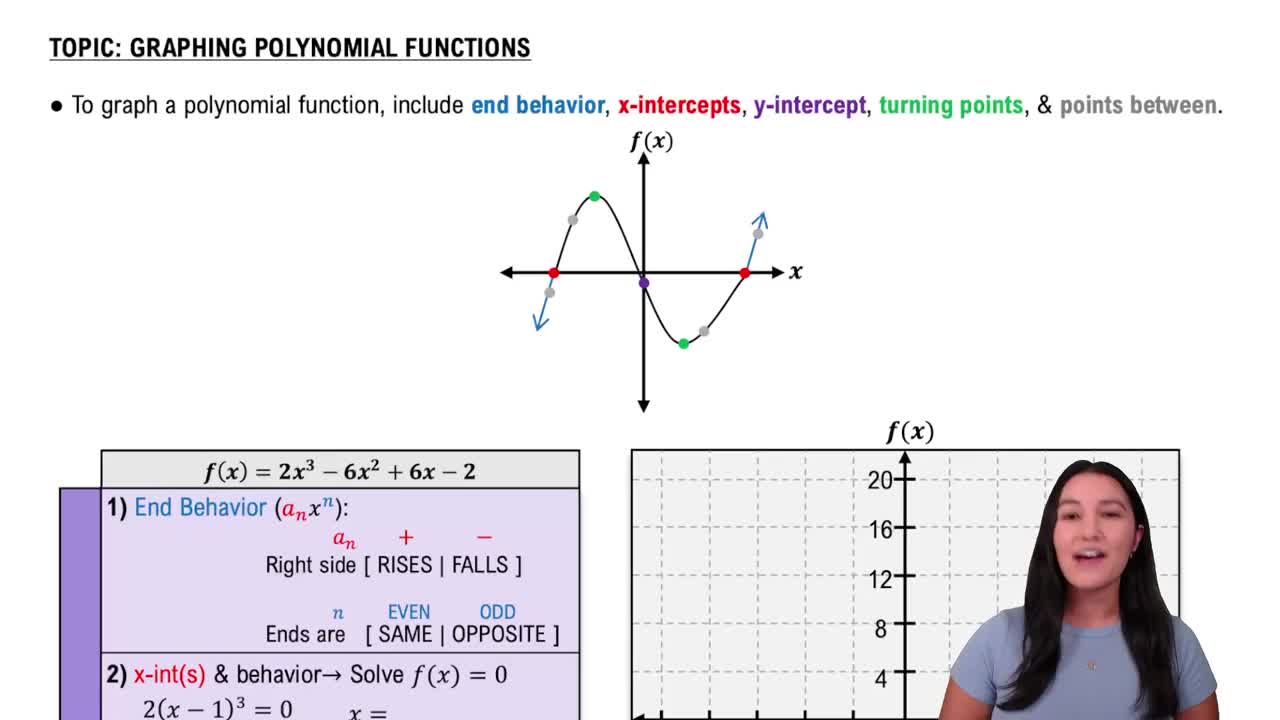
To sketch a polynomial graph by hand, identify zeros, determine their multiplicities, analyze end behavior, and find key points such as local maxima and minima using derivatives or sign changes. This approach helps create an accurate, complete graph without graphing utilities.
Recommended video:
Graphing Polynomial Functions
Related Practice
Textbook Question
Textbook Question
Solve each rational inequality in Exercises 43–60 and graph the solution set on a real number line. Express each solution set in interval notation. (x+4)(x−1)/(x+2)≤0
3
views
Textbook Question
Solve each rational inequality in Exercises 43–60 and graph the solution set on a real number line. Express each solution set in interval notation. (x+4)/x>0
Textbook Question
Use transformations of f(x)=1/x or f(x)=1/x2 to graph each rational function. h(x)=1/x2 − 4
Textbook Question
Write an equation in vertex form of the parabola that has the same shape as the graph of f(x) = 3x2 or g(x) = -3x2, but with the given maximum or minimum. Maximum = 4 at x = -2
2
views
Textbook Question
Solve each rational inequality in Exercises 43–60 and graph the solution set on a real number line. Express each solution set in interval notation. x/(x−3)>0