Textbook Question
Use the graph of y = f(x) to graph each function g.
g(x) = −ƒ( x/2) +1
1
views


 Verified step by step guidance
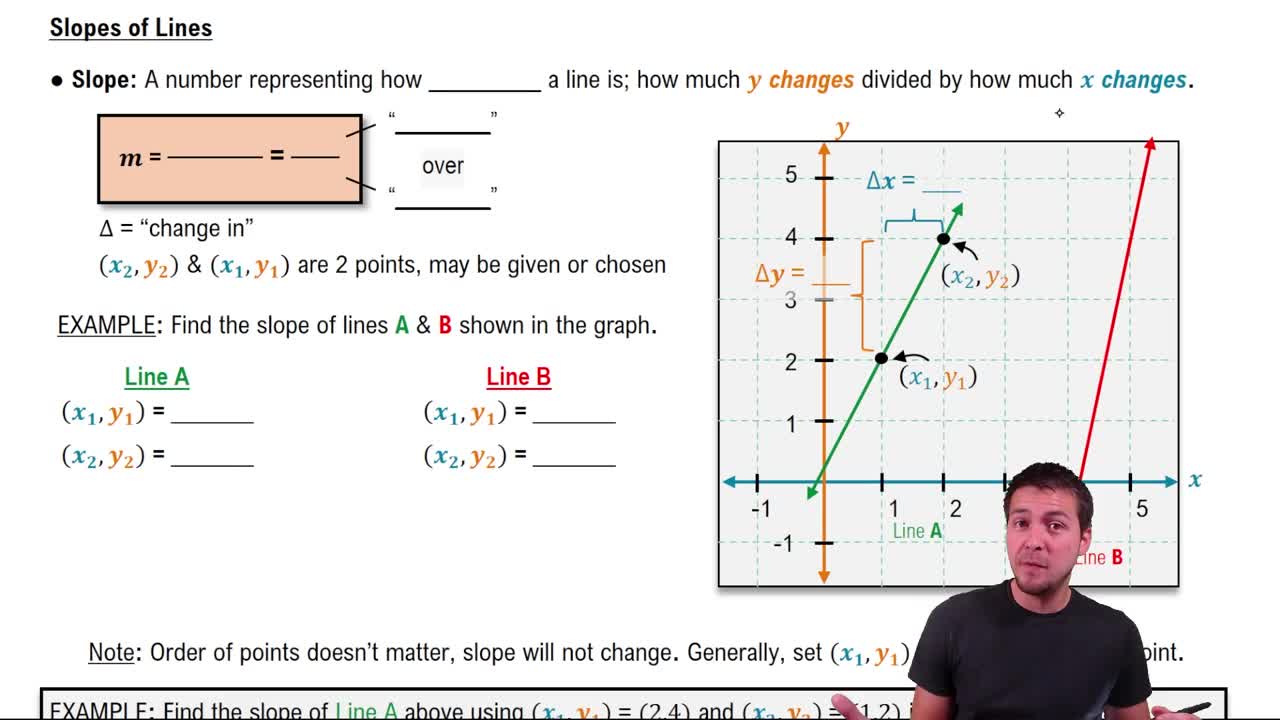
 06:49
06:49 4:56
4:56 02:16
02:16Use the graph of y = f(x) to graph each function g.
g(x) = −ƒ( x/2) +1
Find the average rate of change of the function from x1 to x2. f(x) = x² + 2x from x1 = 3 to x2 = 5
Use the given conditions to write an equation for each line in point-slope form and slope-intercept form. Slope = 8, passing through (4, −1)
Find the distance between each pair of points. If necessary, express answers in simplified radical form and then round to two decimal places. (3√3, √5) and (−√3, 4√5)
Find the distance between each pair of points. If necessary, express answers in simplified radical form and then round to two decimal places. (0, -√2) and (√7,0)
In Exercises 11–26, determine whether each equation defines y as a function of x. x² + y = 25