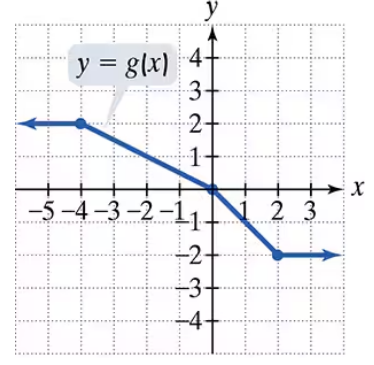
Use the graph to determine a.the x-intercepts, if any; b. the y-intercept, if any; and e. the missing function values, indicated by question marks, below each graph.
Ch. 2 - Functions and Graphs

Chapter 3, Problem 75
Use the graph of g to solve Exercises 71–76.

For what value of x is g(x) = 1?
Verified step by step guidance1
Identify the horizontal line on the graph where the function value is \(g(x) = 1\). This means we are looking for points on the graph where the y-coordinate is 1.
Look across the graph to find all points where the graph intersects the horizontal line \(y = 1\).
Note the x-coordinates of these intersection points, as these are the values of \(x\) for which \(g(x) = 1\).
Write down the x-values corresponding to these points. These are the solutions to the equation \(g(x) = 1\).
Verify by checking the graph that at these x-values, the function's output is indeed 1.

Verified video answer for a similar problem:
This video solution was recommended by our tutors as helpful for the problem above.
Video duration:
1mWas this helpful?
Key Concepts
Here are the essential concepts you must grasp in order to answer the question correctly.
Understanding Function Notation
Function notation, such as g(x), represents the output value of a function g for a given input x. It is essential to interpret g(x) = 1 as finding the x-values where the function's output equals 1.
Recommended video:
End Behavior of Polynomial Functions
Reading Graphs of Functions
To solve for g(x) = 1 using a graph, locate the horizontal line y = 1 and identify the points where the graph of g intersects this line. The x-coordinates of these intersection points are the solutions.
Recommended video:
Graphs of Logarithmic Functions
Interpreting Coordinates on a Graph
Each point on a graph is represented as (x, y), where x is the input and y is the output. Understanding how to read these coordinates allows you to determine the input values corresponding to a specific output, such as g(x) = 1.
Recommended video:
Guided course
Graphs and Coordinates - Example
Related Practice
Textbook Question
1
views
Textbook Question
Begin by graphing the square root function, f(x) = √x. Then use transformations of this graph to graph the given function. g(x) = 2√(x+1)
Textbook Question
Begin by graphing the square root function, f(x) = √x. Then use transformations of this graph to graph the given function. h(x)=√(-x+1)
Textbook Question
Express the given function h as a composition of two functions ƒ and g so that h(x) = (fog) (x).
h(x) = (3x − 1)4
Textbook Question
Find the slope of the line passing through each pair of points or state that the slope is undefined. Assume that all variables represent positive real numbers. Then indicate whether the line through the points rises, falls, is horizontal, or is vertical. (-a, 0) and (0, -b)
Textbook Question
Use the graph of g to solve Exercises 71–76.
For what value of x is g(x) = -1?
