Textbook Question
Express the given function h as a composition of two functions ƒ and g so that h(x) = (fog) (x). h(x) = ∛(x² – 9)

 Verified step by step guidance
 04:08 04:08
 02:16
02:16Express the given function h as a composition of two functions ƒ and g so that h(x) = (fog) (x). h(x) = ∛(x² – 9)
Begin by graphing the square root function, f(x) = √x. Then use transformations of this graph to graph the given function. g(x) = 2√(x+1)
Use the graph of g to solve Exercises 71–76.
For what value of x is g(x) = 1?
Find the domain of each function. g(x) = 4/(x - 7)
Use the graph of g to solve Exercises 71–76.
For what value of x is g(x) = -1?
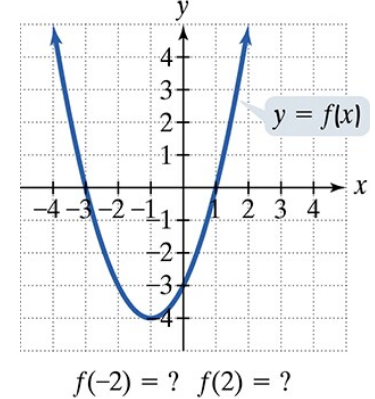
In Exercises 77–92, use the graph to determine a.the x-intercepts, if any; b. the y-intercept, if any; and e. the missing function values, indicated by question marks, below each graph.