Ch. 2 - Functions and Graphs
Blitzer - College Algebra 8th Edition
Blitzer8th EditionCollege AlgebraISBN: 9780136970514Not the one you use?Change textbook
Chapter 3, Problem 72

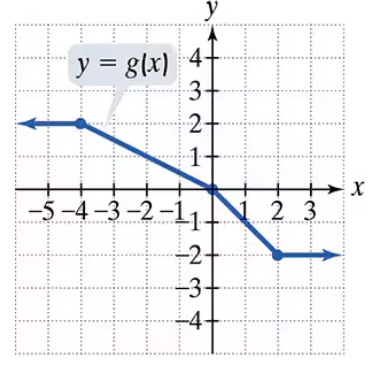
Use the graph of g to solve Exercises 71–76.

Find g(2)

Verified step by step guidance
1
Identify the function g on the graph, which is represented by the red line with points marked.
Locate the x-value of 2 on the horizontal axis (x-axis).
From x = 2, move vertically upwards or downwards until you reach the point on the graph of g.
Determine the y-coordinate of the point on the graph directly above or below x = 2. This y-coordinate is the value of g(2).
Write the value of g(2) as the y-coordinate found in the previous step.

Verified video answer for a similar problem:

This video solution was recommended by our tutors as helpful for the problem above.
Video duration:
1m
Was this helpful?

Key Concepts

Here are the essential concepts you must grasp in order to answer the question correctly.

Function Notation

Function notation, such as g(2), represents the output value of the function g when the input is 2. It is a way to denote the relationship between input values (domain) and output values (range) in a function.
Recommended video:
05:18
Interval Notation

Reading a Graph of a Function

To find g(2) from a graph, locate the input value 2 on the x-axis, then find the corresponding point on the graph. The y-coordinate of this point is the value of g(2). This process helps visualize how the function behaves.
Recommended video:
5:26
Graphs of Logarithmic Functions

Coordinate Plane and Points

The coordinate plane consists of an x-axis (horizontal) and y-axis (vertical). Points on the graph are represented as (x, y), where x is the input and y is the output. Understanding how to interpret these points is essential for analyzing functions.
Recommended video:
Guided course
05:10
Graphs & the Rectangular Coordinate System