 Back
BackGraphs and Coordinates: College Algebra Study Guidance
Study Guide - Smart Notes
 Tailored notes based on your materials, expanded with key definitions, examples, and context.
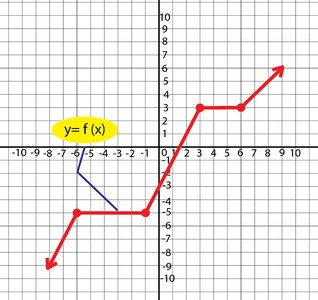
Q1. Find the x-intercept for the graph given below. Also, state the domain of the function in set-builder notation.
Background
Topic: Graphs of Functions, Intercepts, and Domain
This question tests your ability to read a graph, identify the x-intercept (where the graph crosses the x-axis), and determine the domain of the function using set-builder notation.
Key Terms and Formulas
x-intercept: The value(s) of x where the graph crosses the x-axis (i.e., where ).
Domain: The set of all possible x-values for which the function is defined.
Set-builder notation: A way to describe a set by stating the properties that its members must satisfy, e.g., .
Step-by-Step Guidance
Examine the graph and identify the point(s) where the red curve crosses the x-axis. These are your x-intercepts.
To find the x-intercept, look for the value of x where (i.e., where the function value is zero).
Next, determine the domain by observing the leftmost and rightmost x-values for which the graph exists. Pay attention to whether the endpoints are included (closed circle or solid line) or excluded (open circle or gap).
Express the domain in set-builder notation, using inequalities to describe the interval of x-values where the function is defined.
Try solving on your own before revealing the answer!
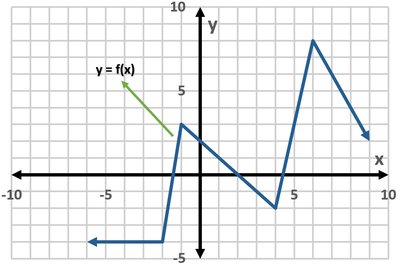
Q2. Based on the given graph, for what value of x is ?
Background
Topic: Reading Function Values from a Graph
This question asks you to find the x-value where the function's output is 5, i.e., where the graph reaches a height of 5 on the y-axis.
Key Terms and Formulas
: This means you are looking for the x-value(s) where the y-coordinate is 5.
Step-by-Step Guidance
Locate the horizontal line on the graph.
Find the point(s) where the graph intersects this line.
Read the corresponding x-value(s) at these intersection points.
Try solving on your own before revealing the answer!
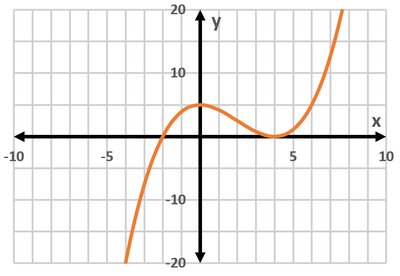
Q3. Find the value of at by using the graph shown.
Background
Topic: Evaluating Functions Using Graphs
This question tests your ability to use a graph to find the value of a function at a specific input.
Key Terms and Formulas
: The output of the function for a given input .
Step-by-Step Guidance
Find on the x-axis of the graph.
Move vertically from until you reach the graph of the function.
Read the y-coordinate at this point. This is the value of .
Try solving on your own before revealing the answer!
Q4. Determine the domain and the range using the graph shown.
Background
Topic: Domain and Range from Graphs
This question asks you to identify the set of all possible input values (domain) and output values (range) for a function based on its graph.
Key Terms and Formulas
Domain: All x-values for which the function is defined.
Range: All y-values that the function can take.
Step-by-Step Guidance
Look at the leftmost and rightmost points of the graph to determine the domain (x-values covered by the graph).
Look at the lowest and highest points of the graph to determine the range (y-values covered by the graph).
Check if the endpoints are included (solid dots or lines) or excluded (open circles or gaps) to decide on using brackets [ ] or parentheses ( ).
Try solving on your own before revealing the answer!
Q5. Plot the following point in the Cartesian coordinate system:
Background
Topic: Plotting Points in the Coordinate Plane
This question tests your understanding of how to plot a point given in fractional coordinates on the Cartesian plane.
Key Terms and Formulas
Cartesian coordinate system: A plane defined by an x-axis (horizontal) and a y-axis (vertical).
Point : is the horizontal position, is the vertical position.
Step-by-Step Guidance
Convert the fractions to decimals if it helps: , .
On the graph, start at the origin (0,0). Move left to .
From there, move up to .
Mark the point at this location.
Try solving on your own before revealing the answer!
Q6. Determine the x and y-intercepts (if there is any) of the graph shown.
Background
Topic: Intercepts of Graphs
This question asks you to find where the graph crosses the x-axis (x-intercepts) and y-axis (y-intercept).
Key Terms and Formulas
x-intercept: Where .
y-intercept: Where .
Step-by-Step Guidance
Look for points where the graph crosses the x-axis. These are your x-intercepts.
Look for the point where the graph crosses the y-axis. This is your y-intercept.
Record the x-values for x-intercepts and the y-value for the y-intercept.
Try solving on your own before revealing the answer!
