 Back
BackGraphs and Coordinates: College Algebra Study Guidance
Study Guide - Smart Notes
 Tailored notes based on your materials, expanded with key definitions, examples, and context.
Header | List | |
|---|---|---|
My name | channels | highted |
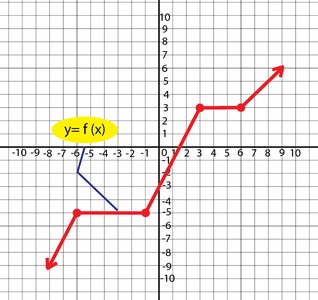
Q1. Find the x-intercept for the graph given below. Also, state the domain of the function in set-builder notation.
Background
Topic: Graphs of Functions, Intercepts, and Domain
This question tests your ability to read a graph, identify the x-intercept (where the graph crosses the x-axis), and determine the domain of the function using set-builder notation.
Key Terms and Formulas
x-intercept: The point(s) where the graph crosses the x-axis. At these points, or .
Domain: The set of all possible -values for which the function is defined. In set-builder notation, it is written as .
Step-by-Step Guidance
Examine the graph and identify the point(s) where the red curve crosses the x-axis. These are your x-intercepts.
To find the domain, look at the leftmost and rightmost points on the graph along the x-axis. Determine the smallest and largest -values for which the function is defined.
Check if the endpoints are included (closed circle or solid line) or excluded (open circle or gap) to decide on the use of , , , or in your set-builder notation.
Write the domain in set-builder notation, such as , where and are the endpoints you identified.
Try solving on your own before revealing the answer!
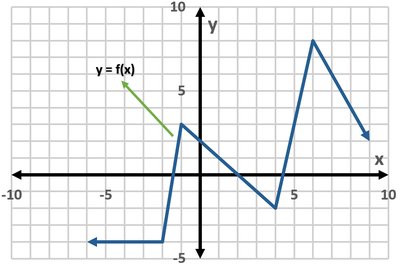
Q2. Based on the given graph, for what value of x is f(x) = 5?
Background
Topic: Reading Values from Graphs
This question asks you to find the -value where the function equals 5, which means finding the -coordinate where the graph reaches a height of 5 on the -axis.
Key Terms and Formulas
: This means you are looking for the -value(s) where the graph's -coordinate is 5.
Step-by-Step Guidance
Locate on the vertical axis of the graph.
Draw or imagine a horizontal line at and see where it intersects the graph of .
Identify the -coordinate(s) at the intersection point(s). These are the values where .
Try solving on your own before revealing the answer!
Q3. Find the value of f at x = 1 by using the graph shown.
Background
Topic: Evaluating Functions from Graphs
This question tests your ability to use a graph to find the value of a function at a specific -value.
Key Terms and Formulas
: The value of the function at a particular .
Step-by-Step Guidance
Find on the horizontal axis of the graph.
Move vertically from until you reach the graph of .
Read the -coordinate at this point. This is the value of .
Try solving on your own before revealing the answer!
Q4. Determine the domain and the range using the graph shown.
Background
Topic: Domain and Range from Graphs
This question asks you to identify the set of all possible -values (domain) and -values (range) for the function shown in the graph.
Key Terms and Formulas
Domain: All -values for which the function is defined.
Range: All -values that the function attains.
Step-by-Step Guidance
Look at the leftmost and rightmost points of the graph to determine the domain (the interval of -values covered by the graph).
Look at the lowest and highest points of the graph to determine the range (the interval of -values covered by the graph).
Check if the endpoints are included or excluded to decide on the use of brackets or parentheses in your interval notation.
Try solving on your own before revealing the answer!
Q5. Plot the following point in the Cartesian coordinate system:
Background
Topic: Plotting Points in the Cartesian Plane
This question tests your understanding of how to plot a point given by coordinates on the Cartesian plane.
Key Terms and Formulas
Cartesian Coordinate System: A plane defined by a horizontal -axis and a vertical -axis.
Point : is the horizontal position, is the vertical position.
Step-by-Step Guidance
Convert and to decimal form if needed for easier plotting.
Start at the origin , move left for negative or right for positive by the -value.
From that position, move up for positive or down for negative by the -value.
Mark the point at the intersection of these positions.
Try solving on your own before revealing the answer!
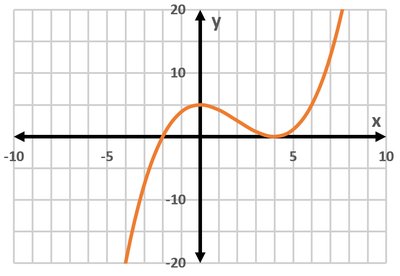
Q6. Determine the x and y-intercepts (if there is any) of the graph shown.
Background
Topic: Intercepts of Graphs
This question asks you to find where the graph crosses the -axis (x-intercepts) and the -axis (y-intercept).
Key Terms and Formulas
x-intercept: Where (the graph crosses the -axis).
y-intercept: Where (the graph crosses the -axis).
Step-by-Step Guidance
Look for points where the graph crosses the -axis. These are your x-intercepts.
Look for the point where the graph crosses the -axis. This is your y-intercept.
Record the -values for the x-intercepts and the -value for the y-intercept.
Try solving on your own before revealing the answer!
