Skip to main content
College Algebra
My Course
Learn
Exam Prep
AI Tutor
Study Guides
Textbook Solutions
Flashcards
Explore
Try the app
My Course
Learn
Exam Prep
AI Tutor
Study Guides
Textbook Solutions
Flashcards
Explore
Try the app
Back
Graphing Systems of Inequalities quiz
You can tap to flip the card.
What is the first step when graphing a two-dimensional inequality?
You can tap to flip the card.
👆
What is the first step when graphing a two-dimensional inequality?
The first step is to graph the corresponding line or curve by replacing the inequality symbol with an equal sign.
Track progress
Control buttons has been changed to "navigation" mode.
1/15
Related flashcards
Related practice
Recommended videos
Graphing Systems of Inequalities definitions
Graphing Systems of Inequalities
15 Terms
Graphing Systems of Inequalities
7. Systems of Equations & Matrices
6 problems
Topic
David-Paige
Determinants and Cramer's Rule
7. Systems of Equations & Matrices
7 problems
Topic
Callie
7. Systems of Equations & Matrices
4 topics
12 problems
Chapter
Callie
Guided course
7:02
Linear Inequalities
5
views
Guided course
3:21
Nonlinear Inequalities
1
views
Guided course
4:37
Example 2
Terms in this set (15)
Hide definitions
What is the first step when graphing a two-dimensional inequality?
The first step is to graph the corresponding line or curve by replacing the inequality symbol with an equal sign.
How do you decide whether to use a solid or dashed line when graphing an inequality?
Use a solid line for 'greater than or equal to' or 'less than or equal to' (≤ or ≥), and a dashed line for 'greater than' or 'less than' (< or >).
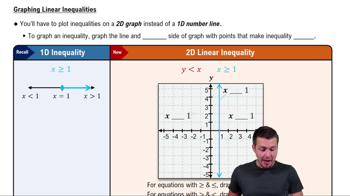
What does the graph of x = 1 look like in two dimensions?
It is a vertical line passing through x = 1 on the x-axis.
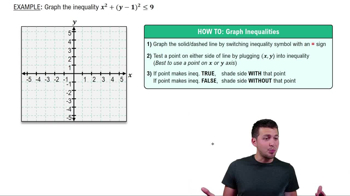
How do you determine which side of the line to shade for a two-dimensional inequality?
Test a point not on the line by plugging its coordinates into the inequality; if the statement is true, shade the side containing that point.
What shortcut can you use when the inequality is in slope-intercept form (y > mx + b or y < mx + b)?
Shade above the line for 'greater than' (>) and below the line for 'less than' (<).
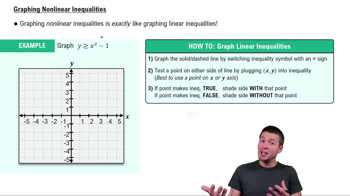
How do you graph a nonlinear inequality like y ≥ x² - 1?
Graph the parabola y = x² - 1 with a solid line, then test a point to determine which side (inside or outside the parabola) to shade.
When graphing a system of inequalities, what does the solution set represent?
The solution set is the region where the shaded areas of all inequalities overlap.
Why might you use different colors or shading styles when graphing systems of inequalities?
Different colors or shading styles help visually distinguish the regions for each inequality and identify the overlapping solution set.
What is the process for testing a point when graphing an inequality?
Pick a point, substitute its coordinates into the inequality, and see if the statement is true or false to decide which region to shade.
How do you graph the inequality y < -x + 4?
Graph the line y = -x + 4 with a solid line, then shade the region below the line.
What happens if the shaded regions of a system of inequalities do not overlap?
If the shaded regions do not overlap, the system has no solution.
How do you graph the inequality y > 2x + 1?
Graph the line y = 2x + 1 with a dashed line, then shade the region above the line.
What is the significance of the vertex when graphing a quadratic inequality like y ≥ x² - 4?
The vertex gives the lowest or highest point of the parabola, helping you sketch the curve accurately before shading.
Can a system of inequalities include both linear and nonlinear equations?
Yes, a system can include both linear and nonlinear equations, and you graph each one using the same steps.
What is the final step after graphing all inequalities in a system?
The final step is to shade the region where all individual shaded areas overlap, which represents the solution to the system.
 BackBack

 7:02
7:02