Skip to main content
College Algebra
My Course
Learn
Exam Prep
AI Tutor
Study Guides
Textbook Solutions
Flashcards
Explore
Try the app
My Course
Learn
Exam Prep
AI Tutor
Study Guides
Textbook Solutions
Flashcards
Explore
Try the app
Back
Graphing Systems of Inequalities definitions
You can tap to flip the card.
Inequality Symbol
You can tap to flip the card.
👆
Inequality Symbol
A mathematical sign indicating the relationship between two expressions, such as greater than, less than, or equal to.
Track progress
Control buttons has been changed to "navigation" mode.
1/15
Related flashcards
Related practice
Recommended videos
Graphing Systems of Inequalities quiz
Graphing Systems of Inequalities
15 Terms
Graphing Systems of Inequalities
7. Systems of Equations & Matrices
6 problems
Topic
David-Paige
Determinants and Cramer's Rule
7. Systems of Equations & Matrices
7 problems
Topic
Callie
7. Systems of Equations & Matrices
4 topics
12 problems
Chapter
Callie
Guided course
7:02
Linear Inequalities
5
views
Guided course
3:21
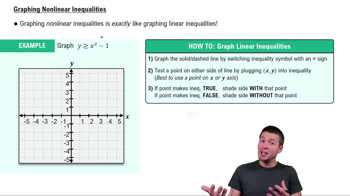
Nonlinear Inequalities
1
views
Guided course
4:37
Example 2
Terms in this set (15)
Hide definitions
Inequality Symbol
A mathematical sign indicating the relationship between two expressions, such as greater than, less than, or equal to.
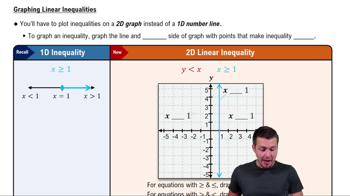
Number Line
A one-dimensional visual representation used to display solutions to inequalities involving a single variable.
Coordinate Plane
A two-dimensional grid defined by x and y axes, used for graphing equations and inequalities with two variables.
Vertical Line
A straight path parallel to the y-axis, representing equations where x equals a constant value.
Solid Line
A boundary on a graph indicating that points on the line satisfy the inequality, used for 'or equal to' cases.
Dashed Line
A boundary on a graph showing that points on the line are not included in the solution set, used for strict inequalities.
Shaded Region
The area on a graph representing all points that satisfy a given inequality or system of inequalities.
Test Point
A specific coordinate chosen to determine which side of a boundary line or curve should be shaded.
Slope-Intercept Form
An equation format, y = mx + b, making it easier to graph lines and determine shading for inequalities.
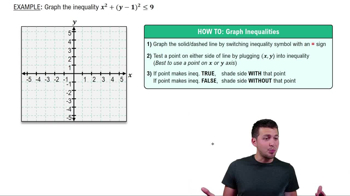
Quadratic Inequality
An inequality involving a squared variable, resulting in a parabolic boundary on the graph.
Parabola
A U-shaped curve representing the graph of a quadratic equation, often used as a boundary in nonlinear inequalities.
System of Inequalities
A set of two or more inequalities graphed together, with solutions found in the overlapping shaded region.
Overlapping Region
The area on a graph where the shaded regions of multiple inequalities intersect, representing the solution set.
Y-Intercept
The point where a graph crosses the y-axis, often used as a starting point for graphing lines.
Solution Set
All points or values that satisfy every inequality in a system, typically visualized as a shaded area on a graph.
 BackBack

 7:02
7:02