Textbook Question
Solve each inequality in Exercises 65–70 and graph the solution set on a real number line. 3/(x +3) > 3/(x - 2)
3
views

 Verified step by step guidance
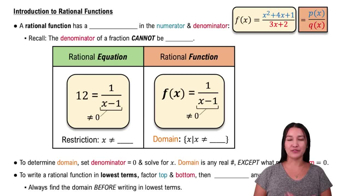
 6:04
6:04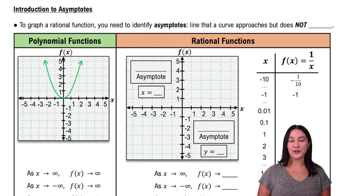 6:24
6:24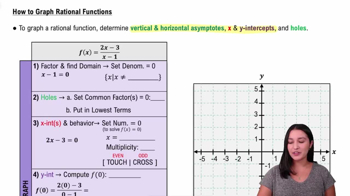 8:19
8:19Solve each inequality in Exercises 65–70 and graph the solution set on a real number line. 3/(x +3) > 3/(x - 2)
Solve each inequality in Exercises 65–70 and graph the solution set on a real number line. |x2 + 2x - 36| > 12
Among all pairs of numbers whose difference is 24, find a pair whose product is as small as possible. What is the minimum product?
Follow the seven steps to graph each rational function. f(x)=2/(x2+x−2)
In Exercises 57–64, find the vertical asymptotes, if any, the horizontal asymptote, if one exists, and the slant asymptote, if there is one, of the graph of each rational function. Then graph the rational function. g(x) = (4x^2 - 16x + 16)/(2x - 3)
Find the domain of each function.