Textbook Question
b. Slopes on a tangent curve What is the smallest value the slope of the curve can ever have on the interval −2 < x < 2? Give reasons for your answer.
 Verified step by step guidance
 06:15
06:15 05:59
05:59 06:21
06:21b. Slopes on a tangent curve What is the smallest value the slope of the curve can ever have on the interval −2 < x < 2? Give reasons for your answer.
Theory and Examples
In Exercises 51–54,
b. Graph y = f(x) and y = f'(x) side by side using separate sets of coordinate axes, and answer the following questions.
y = x⁴/4
By computing the first few derivatives and looking for a pattern, find the following derivatives.
b. d¹¹⁰/dx¹¹⁰ (sin x − 3 cos x)
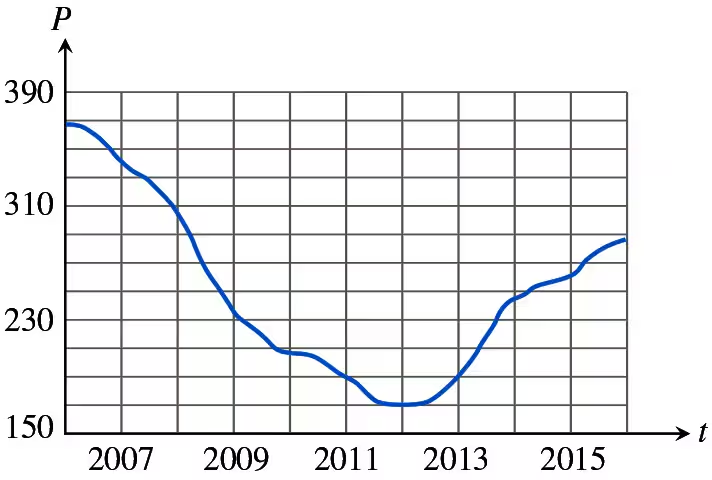
Temperature The given graph shows the outside temperature T in °F, between 6 a.m. and 6 p.m.
b. At what time does the temperature increase most rapidly? Decrease most rapidly? What is the rate for each of those times?
Common linear approximations at x = 0 Find the linearizations of the following functions at x = 0.
b. cos x
Suppose that functions ƒ(x) and g(x) and their first derivatives have the following values at x = 0 and x = 1.
x ƒ(x) g(x) ƒ'(x) g'(x)
0 1 1 -3 1/2
1 3 5 1/2 -4
Find the first derivatives of the following combinations at the given value of x.
b. ƒ(x)g²(x), x = 0