Textbook Question
77–80. Slopes of tangent lines Find all points at which the following curves have the given slope.
x = 2 + √t, y = 2 - 4t; slope = -8

 Verified step by step guidance
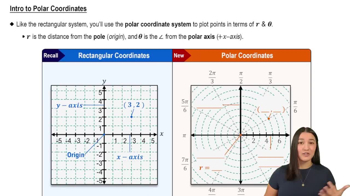
 05:32
05:32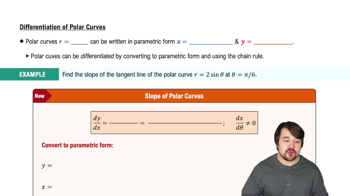 09:04
09:04 06:15
06:1577–80. Slopes of tangent lines Find all points at which the following curves have the given slope.
x = 2 + √t, y = 2 - 4t; slope = -8
13–30. Graphing conic sections Determine whether the following equations describe a parabola, an ellipse, or a hyperbola, and then sketch a graph of the curve. For each parabola, specify the location of the focus and the equation of the directrix; for each ellipse, label the coordinates of the vertices and foci, and find the lengths of the major and minor axes; for each hyperbola, label the coordinates of the vertices and foci, and find the equations of the asymptotes.
25y² - 4x² = 100
33–40. Areas of regions Make a sketch of the region and its bounding curves. Find the area of the region.
The region inside one leaf of r = cos 3θ
49–52. Cartesian-to-polar coordinates Convert the following equations to polar coordinates.
y = x²
13–30. Graphing conic sections Determine whether the following equations describe a parabola, an ellipse, or a hyperbola, and then sketch a graph of the curve. For each parabola, specify the location of the focus and the equation of the directrix; for each ellipse, label the coordinates of the vertices and foci, and find the lengths of the major and minor axes; for each hyperbola, label the coordinates of the vertices and foci, and find the equations of the asymptotes.
10x² - 7y² = 140
53–56. Circular motion Find parametric equations that describe the circular path of the following objects. For Exercises 53–55, assume (x, y) denotes the position of the object relative to the origin at the center of the circle. Use the units of time specified in the problem. There are many ways to describe any circle.
The tip of the 15-inch second hand of a clock completes one revolution in 60 seconds.