Ch. 9 - Differential Equations
Briggs - Calculus: Early Transcendentals 3rd Edition
Briggs3rd EditionCalculus: Early TranscendentalsISBN: 9780136847243Not the one you use?Change textbook
Chapter 9, Problem 9.5.9

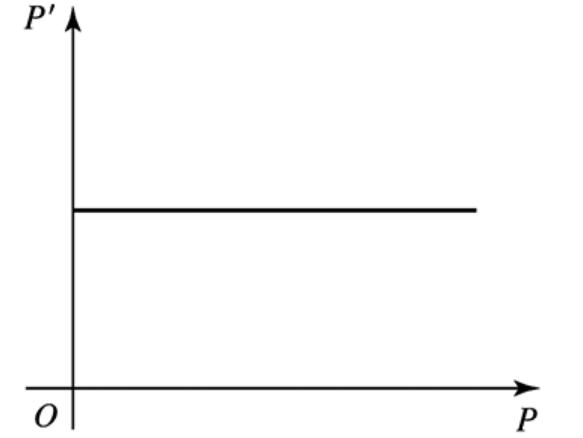
9–14. Growth rate functions Make a sketch of the population function P (as a function of time) that results from the following growth rate functions. Assume the population at time t = 0 begins at some positive value.


<IMAGE>

Verified step by step guidance
1
Step 1: Understand the graph provided. The graph shows the growth rate function \(P'\) plotted against the population \(P\). Here, \(P'\) is constant and positive, meaning the rate of change of the population does not depend on the population size and remains steady over time.
Step 2: Translate the constant positive growth rate into a differential equation. Since \(P'\) is constant, we can write \(\displaystyle \frac{dP}{dt} = k\), where \(k\) is a positive constant representing the constant growth rate.
Step 3: Solve the differential equation. Integrate both sides with respect to \(t\) to find \(P(t)\): \(\displaystyle P(t) = kt + C\), where \(C\) is the initial population at time \(t=0\).
Step 4: Interpret the solution. The population function \(P(t)\) is a linear function of time with a positive slope \(k\), indicating the population increases steadily and linearly over time.
Step 5: Sketch the population function \(P(t)\). Start at the initial population \(C\) on the vertical axis at \(t=0\) and draw a straight line with positive slope \(k\) extending to the right, showing continuous linear growth.

Verified video answer for a similar problem:

This video solution was recommended by our tutors as helpful for the problem above.
Video duration:
4m
Was this helpful?

Key Concepts

Here are the essential concepts you must grasp in order to answer the question correctly.

Population Growth Rate Function

The growth rate function P' represents the rate of change of the population P with respect to time. Understanding how P' behaves (constant, increasing, or decreasing) helps determine the shape of the population function P(t). For example, a constant positive P' means the population grows linearly over time.
Recommended video:
04:16
Intro To Related Rates

Relationship Between Derivative and Function Shape

The derivative P' indicates the slope of the population function P at any point. If P' is constant and positive, P increases linearly. If P' is zero, P is constant. If P' is negative, P decreases. This relationship allows us to sketch P based on the graph of P'.
Recommended video:
06:30
Derivatives of Other Trig Functions

Initial Conditions in Differential Equations

The initial population value at time t=0 sets the starting point for the population function P(t). Given P(0) > 0 and a known growth rate P', we can integrate P' to find P(t) and sketch its behavior over time, ensuring the graph reflects the initial population.
Recommended video:
04:00
Solutions to Basic Differential Equations