Textbook Question
9–10. Velocity graphs The figures show velocity functions for motion along a line. Assume the motion begins with an initial position of s(0)=0. Determine the following.
d. A piecewise function for s(t)

 Verified step by step guidance
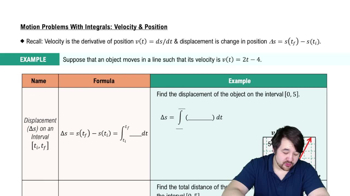
 10:17
10:17 6:13
6:13 11:11
11:119–10. Velocity graphs The figures show velocity functions for motion along a line. Assume the motion begins with an initial position of s(0)=0. Determine the following.
d. A piecewise function for s(t)
Use the region R that is bounded by the graphs of y=1+√x,x=4, and y=1 complete the exercises.
Region R is revolved about the x-axis to form a solid of revolution whose cross sections are washers.
d. Write an integral for the volume of the solid.
Explain why or why not Determine whether the following statements are true and give an explanation or counterexample.
d. A particular marginal cost function has the property that it is positive and decreasing. The cost of increasing production from A units to 2A units is greater than the cost of increasing production from 2A units to 3A units.
Compressing and stretching a spring Suppose a force of 30 N is required to stretch and hold a spring 0.2 m from its equilibrium position.
d. How much additional work is required to stretch the spring 0.2m if it has already been stretched 0.2m from its equilibrium position?
Displacement and distance from velocity Consider the graph shown in the figure, which gives the velocity of an object moving along a line. Assume time is measured in hours and distance is measured in miles. The areas of three regions bounded by the velocity curve and the t-axis are also given.
d. What is the displacement of the object over the interval [0,5]?
Determine whether the following statements are true and give an explanation or counterexample.
d. Let f(x)=12x^2.. The area of the surface generated when the graph of f on [−4, 4] is revolved about the y-axis is twice the area of the surface generated when the graph of f on [0, 4] is revolved about the y-axis.