Textbook Question
Explain why or why not Determine whether the following statements are true and give an explanation or counterexample. Assume ƒ, ƒ', and ƒ'' are continuous functions for all real numbers.
(a) ∫ ƒ(𝓍) ƒ'(𝓍) d𝓍 = ½ (ƒ(𝓍))² + C.
1
views

 Verified step by step guidance
 5:53
5:53 07:15
07:15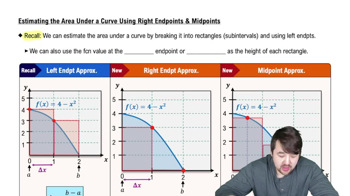 05:59
05:59Explain why or why not Determine whether the following statements are true and give an explanation or counterexample. Assume ƒ, ƒ', and ƒ'' are continuous functions for all real numbers.
(a) ∫ ƒ(𝓍) ƒ'(𝓍) d𝓍 = ½ (ƒ(𝓍))² + C.
Working with area functions Consider the function ƒ and the points a, b, and c.
(a) Find the area function A (𝓍) = ∫ₐˣ ƒ(t) dt using the Fundamental Theorem.
ƒ(𝓍) = cos 𝓍 ; a = 0 , b = π/2 , c = π
Mass from density A thin 10-cm rod is made of an alloy whose density varies along its length according to the function shown in the figure. Assume density is measured in units of g/cm. In Chapter 6, we show that the mass of the rod is the area under the density curve.
(a) Find the mass of the left half of the rod (0 ≤ x ≤ 5) .
Approximating areas Estimate the area of the region bounded by the graph of ƒ(𝓍) = x² + 2 and the x-axis on [0, 2] in the following ways.
(a) Divide [0, 2] into n = 4 subintervals and approximate the area of the region using a left Riemann sum. Illustrate the solution geometrically.
Sigma notation Evaluate the following expressions.
(a) 10
∑ κ
κ=1
Explain why or why not Determine whether the following statements are true and give an explanation or counterexample.
(a) Consider the linear function ƒ(𝓍) = 2x + 5 and the region bounded by its graph and the x-axis on the interval [3,6]. Suppose the area of this region is approximated using midpoint Riemann sums. Then the approximations give the exact area of the region for any number of subintervals.