Ch. 4 - Applications of the Derivative
Briggs - Calculus: Early Transcendentals 3rd Edition
Briggs3rd EditionCalculus: Early TranscendentalsISBN: 9780136847243Not the one you use?Change textbook
Chapter 4, Problem 4.4.14g

if ƒ(x) = 1 / (3x⁴ + 5) , it can be shown that ƒ'(x) = 12x³ / (3x⁴ + 5)² and ƒ"(x) = 180x² (x² + 1) (x + 1) (x - 1) / (3x⁴ + 5)³ . Use these functions to complete the following steps.


g. Use your work in parts (a) through (f) to sketch a graph of ƒ .

Verified step by step guidance
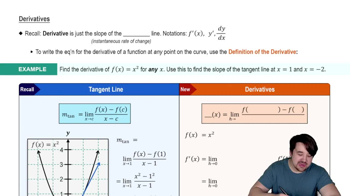
1
Step 1: Identify the critical points of the function ƒ(x) by setting the first derivative ƒ'(x) equal to zero and solving for x. This will help determine where the function has local maxima, minima, or points of inflection.
Step 2: Analyze the sign of ƒ'(x) around the critical points to determine the intervals where the function is increasing or decreasing. This will help in understanding the behavior of the function on different intervals.
Step 3: Use the second derivative ƒ"(x) to determine the concavity of the function. Set ƒ"(x) equal to zero to find potential inflection points, and analyze the sign of ƒ"(x) around these points to determine where the function is concave up or concave down.
Step 4: Consider the asymptotic behavior of the function. Since ƒ(x) is a rational function, examine the behavior as x approaches positive and negative infinity, as well as any vertical asymptotes that may occur when the denominator is zero.
Step 5: Combine the information from the critical points, intervals of increase/decrease, concavity, and asymptotic behavior to sketch the graph of ƒ(x). Ensure that the graph reflects all the analyzed characteristics, such as local extrema, inflection points, and asymptotes.

Verified video answer for a similar problem:

This video solution was recommended by our tutors as helpful for the problem above.
Video duration:
8m
Was this helpful?

Key Concepts

Here are the essential concepts you must grasp in order to answer the question correctly.

Derivative

The derivative of a function measures how the function's output changes as its input changes. It represents the slope of the tangent line to the graph of the function at any given point. In this case, the first derivative ƒ'(x) indicates the rate of change of the function ƒ(x) = 1 / (3x⁴ + 5), which is crucial for understanding the function's behavior, including increasing and decreasing intervals.
Recommended video:
05:44
Derivatives

Second Derivative

The second derivative of a function, denoted as ƒ''(x), provides information about the curvature of the graph of the function. It indicates whether the function is concave up or concave down at a given point. In this context, analyzing the second derivative helps identify points of inflection, where the graph changes its concavity, which is essential for sketching an accurate graph of ƒ.
Recommended video:
06:02
The Second Derivative Test: Finding Local Extrema

Graph Sketching

Graph sketching involves using information from the function and its derivatives to create a visual representation of the function's behavior. This includes identifying critical points, intervals of increase and decrease, concavity, and asymptotic behavior. By applying the first and second derivatives of ƒ(x), one can effectively outline the shape of the graph, including local maxima, minima, and points of inflection.
Recommended video:
11:41
Summary of Curve Sketching