Textbook Question
23–68. Indefinite integrals Determine the following indefinite integrals. Check your work by differentiation.
∫ ((2 + 3 cos y)/sin² y)dy

 Verified step by step guidance
 5:53
5:53 3:56
3:56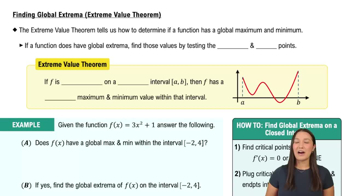 05:12
05:1223–68. Indefinite integrals Determine the following indefinite integrals. Check your work by differentiation.
∫ ((2 + 3 cos y)/sin² y)dy
23–68. Indefinite integrals Determine the following indefinite integrals. Check your work by differentiation.
∫ (3/x⁴ + 2 - 3/x²)
Cylinder and cones (Putnam Exam 1938) Right circular cones of height h and radius r are attached to each end of a right circular cylinder of height h and radius r, forming a double-pointed object. For a given surface area A, what are the dimensions r and h that maximize the volume of the object?
Second Derivative Test Locate the critical points of the following functions. Then use the Second Derivative Test to determine (if possible) whether they correspond to local maxima or local minima.
f(x) = x³ - (3/2)x² - 36x
Verify that the following functions satisfy the conditions of Theorem 4.9 on their domains. Then find the location and value of the absolute extrema guaranteed by the theorem.
f(x) = x√(3-x)
Locating critical points Find the critical points of the following functions. Assume a is a nonzero constant.
ƒ(x) = eˣ + e⁻ˣ