Textbook Question
Derivatives of inverse functions from a table Use the following tables to determine the indicated derivatives or state that the derivative cannot be determined. <IMAGE>
c. (f^-1)'(1)

 Verified step by step guidance
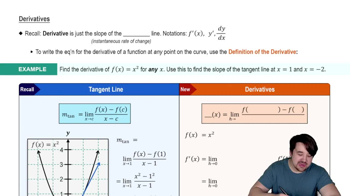
 05:44
05:44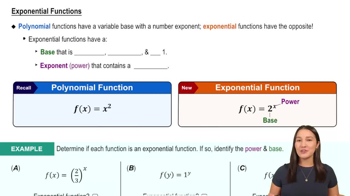 6:13
6:13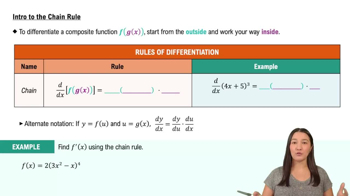 05:02
05:02Derivatives of inverse functions from a table Use the following tables to determine the indicated derivatives or state that the derivative cannot be determined. <IMAGE>
c. (f^-1)'(1)
{Use of Tech} Spring oscillations A spring hangs from the ceiling at equilibrium with a mass attached to its end. Suppose you pull downward on the mass and release it 10 inches below its equilibrium position with an upward push. The distance x (in inches) of the mass from its equilibrium position after t seconds is given by the function x(t) = 10sin t−10cos t, where x is positive when the mass is above the equilibrium position. <IMAGE>
c. At what times is the velocity of the mass zero?
A differential equation is an equation involving an unknown function and its derivatives. Consider the differential equation y′′(t)+y(t) = 0.
b. Show that y = B cos t satisfies the equation for any constant B.
Vertical tangent lines If a function f is continuous at a and lim x→a| f′(x)|=∞, then the curve y=f(x) has a vertical tangent line at a, and the equation of the tangent line is x=a. If a is an endpoint of a domain, then the appropriate one-sided derivative (Exercises 71–72) is used. Use this information to answer the following questions.
73. {Use of Tech} Graph the following functions and determine the location of the vertical tangent lines.
c. f(x) = √|x-4|
Use a graphing utility to graph the curve and the tangent line on the same set of axes.
y = (x + 5) / (x - 1); a = 3
97–100. Logistic growth Scientists often use the logistic growth function P(t) = P₀K / P₀+(K−P₀)e^−r₀t to model population growth, where P₀ is the initial population at time t=0, K is the carrying capacity, and r₀ is the base growth rate. The carrying capacity is a theoretical upper bound on the total population that the surrounding environment can support. The figure shows the sigmoid (S-shaped) curve associated with a typical logistic model. <IMAGE>
{Use of Tech} Gone fishing When a reservoir is created by a new dam, 50 fish are introduced into the reservoir, which has an estimated carrying capacity of 8000 fish. A logistic model of the fish population is P(t) = 400,000 / 50+7950e^−0.5t, where t is measured in years.
c. How fast (in fish per year) is the population growing at t=0? At t=5?