Ch. 2 - Limits
Briggs - Calculus: Early Transcendentals 3rd Edition
Briggs3rd EditionCalculus: Early TranscendentalsISBN: 9780136847243Not the one you use?Change textbook
Chapter 2, Problem 51b

Analyze the following limits. Then sketch a graph of y=tanx with the window [−π,π]×[−10,10]and use your graph to check your work.
lim x→π/2^− tan x

Verified step by step guidance
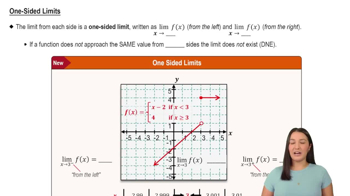
1
Step 1: Understand the behavior of the tangent function, \( y = \tan x \), near \( x = \frac{\pi}{2} \). The tangent function has vertical asymptotes at \( x = \frac{\pi}{2} + k\pi \) for any integer \( k \), where the function approaches infinity as \( x \) approaches these points from the left and negative infinity from the right.
Step 2: Consider the limit \( \lim_{x \to \frac{\pi}{2}^-} \tan x \). This notation \( x \to \frac{\pi}{2}^- \) indicates that \( x \) is approaching \( \frac{\pi}{2} \) from the left side, meaning \( x \) is slightly less than \( \frac{\pi}{2} \).
Step 3: Analyze the behavior of \( \tan x \) as \( x \) approaches \( \frac{\pi}{2} \) from the left. As \( x \) gets closer to \( \frac{\pi}{2} \), the value of \( \tan x \) increases without bound, indicating that the limit approaches positive infinity.
Step 4: Sketch the graph of \( y = \tan x \) over the interval \([-\pi, \pi]\). Note the vertical asymptotes at \( x = -\frac{\pi}{2} \) and \( x = \frac{\pi}{2} \), where the function approaches infinity from the left and negative infinity from the right.
Step 5: Use the graph to verify your analysis. Observe that as \( x \) approaches \( \frac{\pi}{2} \) from the left, the graph of \( \tan x \) indeed rises steeply towards positive infinity, confirming the limit \( \lim_{x \to \frac{\pi}{2}^-} \tan x = +\infty \).

Verified video answer for a similar problem:

This video solution was recommended by our tutors as helpful for the problem above.
Video duration:
1m
Was this helpful?

Key Concepts

Here are the essential concepts you must grasp in order to answer the question correctly.

Limits

A limit is a fundamental concept in calculus that describes the behavior of a function as its input approaches a certain value. It helps in understanding the function's behavior near points of interest, including points where the function may not be defined. For example, the limit of tan(x) as x approaches π/2 from the left indicates how the function behaves as it nears this vertical asymptote.
Recommended video:
05:50
One-Sided Limits

Vertical Asymptotes

Vertical asymptotes occur in functions where the function approaches infinity or negative infinity as the input approaches a certain value. For the tangent function, vertical asymptotes are found at odd multiples of π/2, where the function is undefined. Understanding vertical asymptotes is crucial for analyzing the limits of functions like tan(x) and for sketching accurate graphs.
Recommended video:
3:40
Introduction to Cotangent Graph Example 1

Graphing Trigonometric Functions

Graphing trigonometric functions, such as y = tan(x), involves understanding their periodic nature and key features like asymptotes, intercepts, and periodicity. The tangent function has a period of π and exhibits vertical asymptotes at odd multiples of π/2. By sketching the graph within a specified window, one can visually confirm the behavior of the function and the accuracy of calculated limits.
Recommended video:
6:04
Introduction to Trigonometric Functions