Textbook Question
Use the graph of in the figure to find the following values or state that they do not exist. <IMAGE>

 Verified step by step guidance
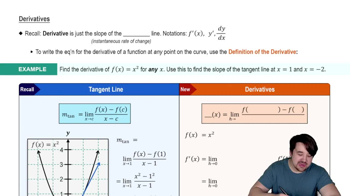
 05:44
05:44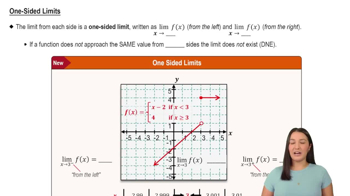 05:50
05:50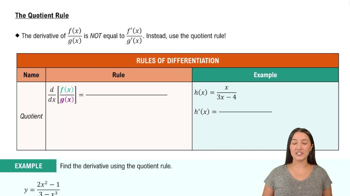 06:43
06:43Use the graph of in the figure to find the following values or state that they do not exist. <IMAGE>
The graph of ℎ in the figure has vertical asymptotes at x=−2 and x=3. Analyze the following limits. <IMAGE>
lim x→3^+ h(x)
What does it mean for a function to be continuous on an interval?
Use the graph of in the figure to find the following values or state that they do not exist. <IMAGE>
The graph of f in the figure has vertical asymptotes at x=1 and x=2. Analyze the following limits. <IMAGE>
lim x→2 f (x)
The graph of ℎ in the figure has vertical asymptotes at x=−2 and x=3. Analyze the following limits. <IMAGE>
lim x→3 h(x)