Ch. 1 - Functions
Briggs - Calculus: Early Transcendentals 3rd Edition
Briggs3rd EditionCalculus: Early TranscendentalsISBN: 9780136847243Not the one you use?Change textbook
Chapter 1, Problem 40a

The graph of ƒ is shown in the figure. Graph the following functions. <IMAGE>
a. ƒ(x+1)ƒ( x + 1)

Verified step by step guidance
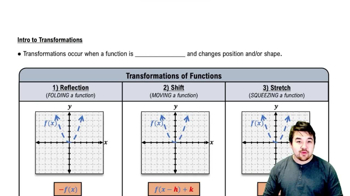
1
Identify the transformation: The function \( f(x + 1) \) represents a horizontal shift of the graph of \( f(x) \).
Determine the direction of the shift: Since the transformation is \( f(x + 1) \), the graph of \( f(x) \) will shift to the left by 1 unit.
Sketch the new graph: Take each point on the original graph of \( f(x) \) and move it 1 unit to the left to obtain the graph of \( f(x + 1) \).
Check key points: Verify that key points on the graph, such as intercepts and turning points, have been shifted correctly.
Ensure continuity and shape: Make sure the overall shape and continuity of the graph are preserved after the transformation.

Verified video answer for a similar problem:

This video solution was recommended by our tutors as helpful for the problem above.
Video duration:
4m
Was this helpful?

Key Concepts

Here are the essential concepts you must grasp in order to answer the question correctly.

Function Transformation

Function transformation refers to the changes made to the graph of a function based on modifications to its equation. Common transformations include translations, reflections, stretches, and compressions. For instance, adding a constant to the input of a function, such as ƒ(x + 1), results in a horizontal shift of the graph to the left by one unit.
Recommended video:
5:25
Intro to Transformations

Horizontal Shift

A horizontal shift occurs when the graph of a function is moved left or right along the x-axis. Specifically, for a function ƒ(x + c), where c is a positive constant, the graph shifts to the left by c units. Conversely, if c is negative, the graph shifts to the right. This concept is crucial for accurately graphing transformed functions.
Recommended video:
5:25
Intro to Transformations

Graphing Functions

Graphing functions involves plotting points on a coordinate plane to visually represent the relationship between the input (x-values) and output (y-values) of a function. Understanding how to graph functions, including their transformations, is essential for interpreting their behavior and characteristics, such as intercepts, asymptotes, and overall shape.
Recommended video:
5:53
Graph of Sine and Cosine Function