Ch. 1 - Functions
Briggs - Calculus: Early Transcendentals 3rd Edition
Briggs3rd EditionCalculus: Early TranscendentalsISBN: 9780136847243Not the one you use?Change textbook
Chapter 1, Problem 9

How do you obtain the graph of y=f(x+2)y=f\(\left\)(x+2\(\right\)) from the graph of y=f(x)y=f\(\left\)(x\(\right\))?

Verified step by step guidance
1
Understand that the expression y = f(x + 2) represents a horizontal transformation of the function y = f(x).
Recognize that adding a positive number inside the function's argument, such as x + 2, results in a horizontal shift to the left.
To graph y = f(x + 2), take each point (x, y) on the graph of y = f(x) and shift it 2 units to the left, resulting in the new point (x - 2, y).
Ensure that all points on the original graph are shifted consistently to maintain the shape of the graph.
Check the new graph to confirm that it accurately represents the function y = f(x + 2) by verifying a few key points and their transformations.

Verified video answer for a similar problem:

This video solution was recommended by our tutors as helpful for the problem above.
Video duration:
5m

Key Concepts

Here are the essential concepts you must grasp in order to answer the question correctly.

Function Transformation

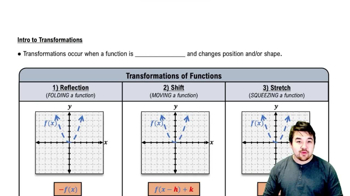
Function transformation refers to the process of altering the graph of a function through shifts, stretches, or reflections. In this case, the function y = f(x + 2) represents a horizontal shift of the original function y = f(x) to the left by 2 units. Understanding how these transformations affect the graph is crucial for accurately sketching or interpreting the new function.
Recommended video:
Guided course
5:25
Intro to Transformations

Horizontal Shifts

Horizontal shifts occur when the input variable of a function is adjusted by adding or subtracting a constant. For the function y = f(x + 2), the addition of 2 inside the function's argument indicates a shift to the left. This concept is essential for predicting how the graph will move in relation to the original function.
Recommended video:
Guided course
5:28
Horizontal Parabolas

Graphing Functions

Graphing functions involves plotting points on a coordinate plane to visually represent the relationship between the input (x) and output (y) values. To graph y = f(x + 2), one must first understand the original graph of y = f(x) and then apply the horizontal shift. This skill is fundamental in calculus for analyzing and interpreting functions.
Recommended video:
Guided course
5:53
Graph of Sine and Cosine Function