Skip to main content
Calculus
My Course
Learn
Exam Prep
AI Tutor
Study Guides
Textbook Solutions
Flashcards
Explore
Try the app
My Course
Learn
Exam Prep
AI Tutor
Study Guides
Textbook Solutions
Flashcards
Explore
Try the app
Back
Estimating Area with Finite Sums quiz
You can tap to flip the card.
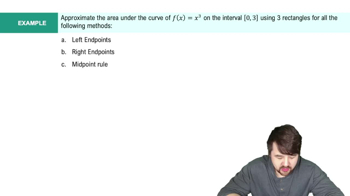
What is the general process for estimating the area under a curve?
You can tap to flip the card.
👆
What is the general process for estimating the area under a curve?
Divide the region under the curve into rectangles, calculate each rectangle's area, and sum them all together.
Track progress
Control buttons has been changed to "navigation" mode.
1/15
Related flashcards
Related practice
Recommended videos
Estimating Area with Finite Sums definitions
Estimating Area with Finite Sums
15 Terms
Estimating Area with Finite Sums
8. Definite Integrals
4 problems
Topic
Ernest
Riemann Sums
8. Definite Integrals
5 problems
Topic
Justin
8. Definite Integrals - Part 1 of 2
5 topics
14 problems
Chapter
Ernest
8. Definite Integrals - Part 2 of 2
1 topic
3 problems
Chapter
Ernest
05:59
Estimating the Area Under a Curve with Right Endpoints & Midpoint
1
views
09:17
Estimating the Area Under a Curve with Right Endpoints & Midpoint Example 1
07:59
Estimating the Area Under a Curve Using Left Endpoints
Terms in this set (15)
Hide definitions
What is the general process for estimating the area under a curve?
Divide the region under the curve into rectangles, calculate each rectangle's area, and sum them all together.
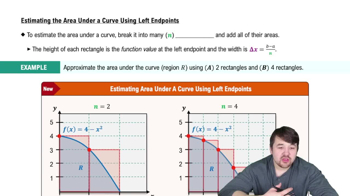
What does 'n' represent when estimating area under a curve?
'n' represents the number of rectangles or subintervals used in the estimation.
How do you calculate the width (Δx) of each rectangle?
Δx is calculated as (b - a) / n, where [a, b] is the interval and n is the number of rectangles.
When using left endpoints, how do you determine the height of each rectangle?
The height is the function value at the left endpoint of each subinterval.
How does increasing the number of rectangles affect the accuracy of the area estimation?
Increasing the number of rectangles generally makes the estimation more accurate.
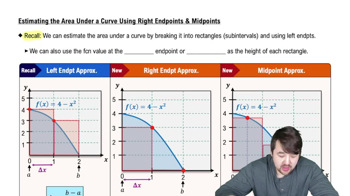
What is the main difference between left endpoint and right endpoint approximations?
The main difference is that left endpoint uses the left side of each subinterval for the height, while right endpoint uses the right side.
How do you find the height for a right endpoint approximation?
Use the function value at the right endpoint of each subinterval for the height.
What is a midpoint approximation?
A midpoint approximation uses the function value at the midpoint of each subinterval as the height of the rectangle.
Why is the midpoint approximation often more accurate than left or right endpoint approximations?
Because it balances overestimations and underestimations, often resulting in a value closer to the true area.
What formula do you use to find the midpoint of a subinterval [x_i, x_{i+1}]?
The midpoint is (x_i + x_{i+1}) / 2.
Does the width of rectangles change when using different approximation methods (left, right, midpoint) for the same number of rectangles?
No, the width remains the same; only the heights change based on the chosen method.
What happens to the estimation if you use only one large rectangle?
The estimation becomes much less accurate compared to using more rectangles.
What is the area of a rectangle formula used in these approximations?
Area = width × height.
What do you call the extra area that 'peeks over' or is missed by the rectangles in these approximations?
This is the estimation error, resulting from the rectangles not perfectly matching the curve.
Why do we use rectangle approximations instead of exact area calculations under a curve?
Because the region under a curve often does not have a simple geometric shape, so rectangles provide a practical way to estimate the area.
 BackBack
 05:59
05:59