Skip to main content
Calculus
My Course
Learn
Exam Prep
AI Tutor
Study Guides
Textbook Solutions
Flashcards
Explore
Try the app
My Course
Learn
Exam Prep
AI Tutor
Study Guides
Textbook Solutions
Flashcards
Explore
Try the app
Back
Estimating Area with Finite Sums definitions
You can tap to flip the card.
Area Under a Curve
You can tap to flip the card.
👆
Area Under a Curve
Region between a function's graph and the x-axis, often estimated using geometric shapes when an exact formula is unavailable.
Track progress
Control buttons has been changed to "navigation" mode.
1/15
Related flashcards
Related practice
Recommended videos
Estimating Area with Finite Sums quiz
Estimating Area with Finite Sums
15 Terms
Estimating Area with Finite Sums
8. Definite Integrals
4 problems
Topic
Ernest
Riemann Sums
8. Definite Integrals
5 problems
Topic
Justin
8. Definite Integrals - Part 1 of 2
5 topics
14 problems
Chapter
Ernest
8. Definite Integrals - Part 2 of 2
1 topic
3 problems
Chapter
Ernest
05:59
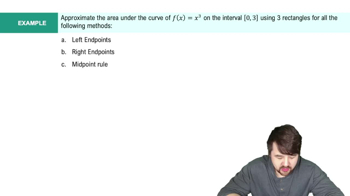
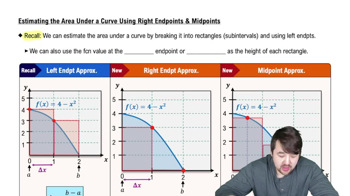
Estimating the Area Under a Curve with Right Endpoints & Midpoint
1
views
09:17
Estimating the Area Under a Curve with Right Endpoints & Midpoint Example 1
07:59
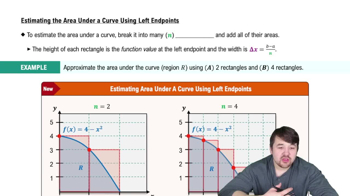
Estimating the Area Under a Curve Using Left Endpoints
Terms in this set (15)
Hide definitions
Area Under a Curve
Region between a function's graph and the x-axis, often estimated using geometric shapes when an exact formula is unavailable.
Rectangle Approximation
Method of estimating a region's size by dividing it into rectangles and summing their areas, adjusting for accuracy with more rectangles.
Subinterval
One of the equal divisions of an interval over which rectangles are constructed to estimate a region's area.
Left Endpoint
Starting value of a subinterval used to determine the height of each rectangle in an area estimation.
Right Endpoint
Ending value of a subinterval used to determine the height of each rectangle in an area estimation.
Midpoint
Value exactly halfway between the endpoints of a subinterval, often yielding the most balanced area estimate.
Delta x
Uniform width of each rectangle, calculated by dividing the total interval length by the number of rectangles.
Overestimation
Situation where the sum of rectangle areas exceeds the true region, often due to rectangles extending above the curve.
Underestimation
Situation where the sum of rectangle areas falls short of the true region, often due to rectangles missing parts under the curve.
Function Value
Output of a function at a specific input, used as the height of a rectangle in area approximations.
Interval
Continuous section on the x-axis over which the area under a curve is estimated.
Number of Rectangles
Quantity of divisions used in the approximation, with higher counts generally improving accuracy.
Approximation
Calculated value close to the actual area, obtained by summing the areas of constructed rectangles.
Width
Horizontal measure of each rectangle, consistent across all rectangles in uniform partitioning.
Height
Vertical measure of each rectangle, determined by the function's value at a chosen point within the subinterval.
 BackBack
 05:59
05:59