Skip to main content
Statistics for Business
My Course
Learn
Exam Prep
AI Tutor
Study Guides
Flashcards
Explore
Try the app
My Course
Learn
Exam Prep
AI Tutor
Study Guides
Flashcards
Explore
Try the app
Back
Regression Line Equation and Coefficient of Determination - Excel quiz
You can tap to flip the card.
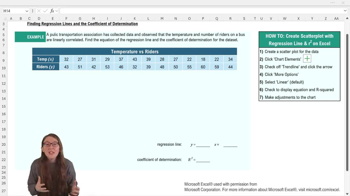
What is the first step to finding the regression line equation and R-squared in Excel?
You can tap to flip the card.
👆
What is the first step to finding the regression line equation and R-squared in Excel?
The first step is to create a scatterplot of your data in Excel.
Track progress
Control buttons has been changed to "navigation" mode.
1/15
Related flashcards
Related practice
Recommended videos
Regression Line Equation and Coefficient of Determination - Excel definitions
Regression Line Equation and Coefficient of Determination - Excel
15 Terms
12. Regression - Part 1 of 2
4 topics
15 problems
Chapter
Ally
12. Regression - Part 2 of 2
2 topics
Chapter
Guided course
05:27
Regression Line Equation and Coefficient of Determination - Excel Example 1
1
views
Guided course
03:28
Regression Line Equation and Coefficient of Determination - Excel
1
views
Terms in this set (15)
Hide definitions
What is the first step to finding the regression line equation and R-squared in Excel?
The first step is to create a scatterplot of your data in Excel.
How do you add a trend line to a scatterplot in Excel?
You add a trend line by selecting the chart, going to the chart elements menu, and checking off the 'Trendline' option.
What should you do after adding a trend line to display the regression equation and R-squared value?
You should select 'More Options' for the trend line, then check 'Display Equation on chart' and 'Display R squared value on chart.'
What does the regression line equation in Excel typically look like?
It is usually in the form y = mx + b, where m is the slope and b is the y-intercept.
What does the coefficient of determination (R-squared) represent?
R-squared represents the proportion of variation in the response variable explained by the explanatory variable.
If R-squared is 0.87, what does this mean in context?
It means that 87% of the variation in the y variable can be explained by the variation in the x variable.
Why might you want to move the regression equation and R-squared value on your Excel chart?
You might move them to make them easier to read and not cover any data points.
Why is it important to label your axes and chart title in Excel?
Proper labeling makes the graph easy to interpret and ensures clarity about what the data represents.
What should you do if the regression equation or R-squared value is hard to read on the chart?
You can write them somewhere else on your worksheet or adjust the font size for better readability.
What is the default type of trend line Excel uses when you add one to a scatterplot?
The default trend line type is linear.
How can you round the regression equation values in Excel for easier use?
You can manually round the slope and intercept values, following your professor's rounding policy.
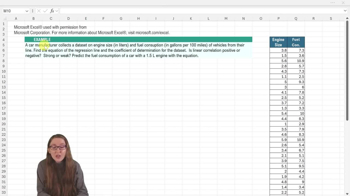
What is the purpose of the regression line in predictive analytics?
The regression line predicts values of the response variable based on the explanatory variable.
What Excel menu do you use to add chart elements like a trend line?
You use the 'Chart Design' menu and select 'Add Chart Element.'
What does the y-intercept represent in the regression line equation?
The y-intercept is the predicted value of y when x equals zero.
Why is it useful to visualize data with a scatterplot before adding a regression line?
A scatterplot helps you see the relationship between variables and assess if a linear model is appropriate.
 BackBack
 05:27
05:27