Skip to main content
Statistics for Business
My Course
Learn
Exam Prep
AI Tutor
Study Guides
Flashcards
Explore
Try the app
My Course
Learn
Exam Prep
AI Tutor
Study Guides
Flashcards
Explore
Try the app
Back
Regression Line Equation and Coefficient of Determination - Excel definitions
You can tap to flip the card.
Regression Line
You can tap to flip the card.
👆
Regression Line
A straight line on a scatterplot that best predicts the response variable using the explanatory variable.
Track progress
Control buttons has been changed to "navigation" mode.
1/15
Related flashcards
Related practice
Recommended videos
Regression Line Equation and Coefficient of Determination - Excel quiz
Regression Line Equation and Coefficient of Determination - Excel
15 Terms
12. Regression - Part 1 of 2
4 topics
15 problems
Chapter
Ally
12. Regression - Part 2 of 2
2 topics
Chapter
Guided course
05:27
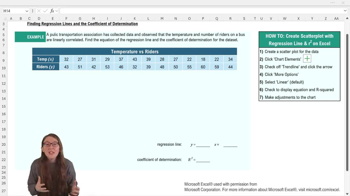
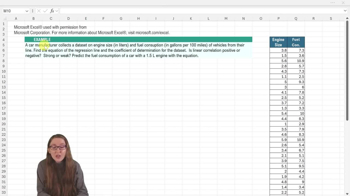
Regression Line Equation and Coefficient of Determination - Excel Example 1
1
views
Guided course
03:28
Regression Line Equation and Coefficient of Determination - Excel
1
views
Terms in this set (15)
Hide definitions
Regression Line
A straight line on a scatterplot that best predicts the response variable using the explanatory variable.
Coefficient of Determination
A value, often shown as R-squared, indicating the proportion of variation in the response variable explained by the explanatory variable.
Scatterplot
A chart displaying paired data points, used to visualize the relationship between two variables.
Trend Line
A line added to a scatterplot to show the general direction or pattern of the data.
Explanatory Variable
A variable used to predict or explain changes in another variable, often plotted on the x-axis.
Response Variable
A variable whose variation is being studied and predicted, typically shown on the y-axis.
Linear Correlation
A relationship between two variables where data points tend to follow a straight-line pattern.
Y-intercept
The value where the regression line crosses the y-axis, representing the predicted response when the explanatory variable is zero.
Slope
A measure of how much the response variable changes for each unit increase in the explanatory variable.
R-squared
A statistical measure, ranging from 0 to 1, that quantifies how well the regression line fits the data.
Chart Elements
Features in Excel charts, such as titles, axes, and trend lines, that enhance data interpretation.
Data Variation
The extent to which data points differ from each other within a dataset.
Predictive Analytics
The use of statistical techniques to forecast future values based on current and historical data.
Axis Titles
Labels on chart axes that clarify what each axis represents, aiding in graph interpretation.
Rounding
The process of adjusting numerical values to a specified degree of precision for easier interpretation.
 BackBack
 05:27
05:27