 Back
BackIntroduction to Functions and Their Graphs
Study Guide - Smart Notes
 Tailored notes based on your materials, expanded with key definitions, examples, and context.
0. Functions
Intro to Functions & Their Graphs
This section introduces the foundational concepts of relations and functions, which are essential for understanding business calculus. It explains how to distinguish between general relations and functions, and provides a graphical method for identifying functions using the Vertical Line Test.
Relations and Functions
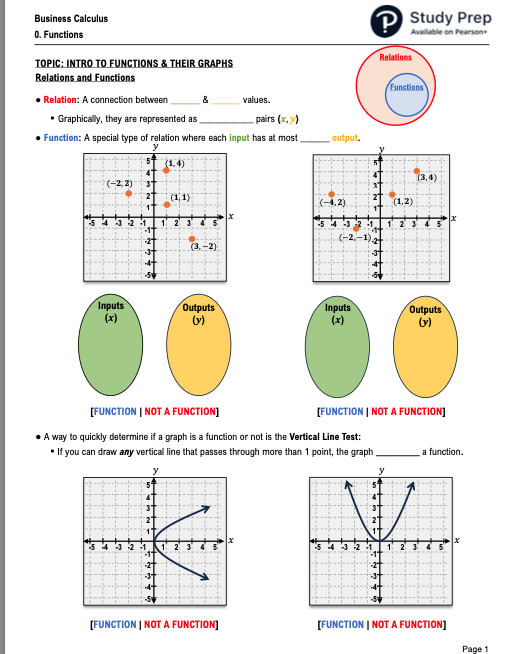
Relation: A relation is a connection between two sets of values, typically called inputs and outputs. Graphically, relations are represented as ordered pairs (x, y) on the coordinate plane.
Function: A function is a special type of relation in which each input (x-value) is associated with at most one output (y-value). In other words, no input value maps to more than one output value.
Key Points:
Every function is a relation, but not every relation is a function.
Functions are fundamental in modeling real-world business scenarios where each input (such as time or cost) produces a unique output (such as revenue or profit).
Example: Consider the following sets of points:
Set 1: {(-2,2), (1,1), (3,-2)} – Each x-value is paired with only one y-value, so this is a function.
Set 2: {(-4,2), (1,2), (3,4), (-2,-2)} – The x-value 1 is paired with 2, but no x-value is repeated with a different y-value, so this is also a function.
If an x-value is paired with more than one y-value, the relation is not a function.
Vertical Line Test
The Vertical Line Test is a graphical method to determine if a relation is a function:
If any vertical line drawn on the graph passes through more than one point of the graph, then the graph does not represent a function.
If every vertical line passes through at most one point, the graph does represent a function.
Example:
The graph of y = x^2 passes the vertical line test and is a function.
The graph of a circle, such as x^2 + y^2 = 1, fails the vertical line test and is not a function.
Summary Table:
Graph/Relation | Function? | Reason |
|---|---|---|
Each input has one output | Yes | Passes vertical line test |
Some inputs have multiple outputs | No | Fails vertical line test |
Additional info: In business calculus, functions are used to model cost, revenue, profit, and other business metrics as a function of time, quantity, or other variables. Understanding the definition and graphical representation of functions is crucial for further study in calculus.
