Textbook Question
Graph each function. See Examples 6–8. ƒ(x) = √x + 2
1
views
 Verified step by step guidance
 3:43
3:43 5:57
5:57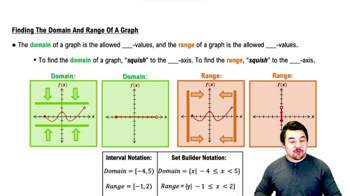 5:10
5:10Graph each function. See Examples 6–8. ƒ(x) = √x + 2
Use a number line to determine whether each statement is true or false. -3 > -3
Determine the largest open intervals of the domain over which each function is (a) increasing See Example 8.
Use a number line to determine whether each statement is true or false. 3 > -2
Factor each polynomial completely. See Example 6. 6a² - 11a + 4
Determine the largest open intervals of the domain over which each function is (b) decreasing. See Example 8.