Textbook Question
Use a calculator to approximate the value of each expression. Give answers to six decimal places. In Exercises 21–28, simplify the expression before using the calculator. See Example 1.
1/ sec 14.8°
8
views

 Verified step by step guidance
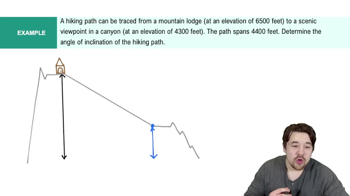
 3:22
3:22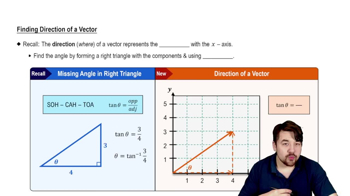 05:13
05:13 04:19
04:19Use a calculator to approximate the value of each expression. Give answers to six decimal places. In Exercises 21–28, simplify the expression before using the calculator. See Example 1.
1/ sec 14.8°
Solve each problem. See Examples 1 and 2. Distance Traveled by a Ship A ship travels 55 km on a bearing of 27° and then travels on a bearing of 117° for 140 km. Find the distance from the starting point to the ending point.
Use a calculator to approximate the value of each expression. Give answers to six decimal places. In Exercises 21–28, simplify the expression before using the calculator. See Example 1. cot 183° 48'
CONCEPT PREVIEW Match each trigonometric function value or angle in Column I with its appropriate approximation in Column II.
Column I: 1.
csc⁻¹ 4
Column II:
A. 88.09084757°
B. 63.25631605°
C. 1.909152433°
D. 17.45760312°
E. 0.2867453858
F. 1.962610506
G. 14.47751219°
H. 1.015426612
I. 1.051462224
J. 0.9925461516
CONCEPT PREVIEW Match the measure of bearing in Column I with the appropriate graph in Column II.
I. 8. 270°
II.
1. A. B. C. 2. 3. 4. D. E. F. 5. 6. 7. G. H. 9. 10. I. J.
(Modeling) Length of a Sag Curve When a highway goes downhill and then uphill, it has a sag curve. Sag curves are designed so that at night, headlights shine sufficiently far down the road to allow a safe stopping distance. See the figure. S and L are in feet. The minimum length L of a sag curve is determined by the height h of the car's headlights above the pavement, the downhill grade θ₁ < 0°, the uphill grade θ₂ > 0°, and the safe stopping distance S for a given speed limit. In addition, L is dependent on the vertical alignment of the headlights. Headlights are usually pointed upward at a slight angle α above the horizontal of the car. Using these quantities, for a 55 mph speed limit, L can be modeled by the formula (θ₂ - θ₁)S² L = ————————— , 200(h + S tan α) where S < L. (Data from Mannering, F., and W. Kilareski, Principles of Highway Engineering and Traffic Analysis, Second Edition, John Wiley and Sons.) Compute length L, to the nearest foot, if h = 1.9 ft, α = 0.9°, θ₁ = -3°, θ₂ = 4°, and S = 336 ft.