In Exercises 11–20, use a polar coordinate system like the one shown for Exercises 1–10 to plot each point with the given polar coordinates. (−2, − π/2)
Ch. 5 - Complex Numbers, Polar Coordinates and Parametric Equations

All textbooks
Blitzer 3rd Edition
Ch. 5 - Complex Numbers, Polar Coordinates and Parametric Equations
Problem 19
Blitzer 3rd Edition
Ch. 5 - Complex Numbers, Polar Coordinates and Parametric Equations
Problem 19Chapter 5, Problem 19
In Exercises 13–34, test for symmetry and then graph each polar equation. r = 2 + cos θ
Verified step by step guidance
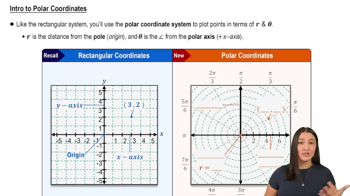
1
Recall the three common tests for symmetry in polar coordinates: symmetry about the polar axis (x-axis), symmetry about the line \( \theta = \frac{\pi}{2} \) (y-axis), and symmetry about the pole (origin).
To test symmetry about the polar axis, replace \( \theta \) with \( -\theta \) in the equation and check if the equation remains unchanged. For \( r = 2 + \cos \theta \), substitute \( -\theta \) to get \( r = 2 + \cos(-\theta) \). Since \( \cos(-\theta) = \cos \theta \), the equation is unchanged, so the graph is symmetric about the polar axis.
To test symmetry about the line \( \theta = \frac{\pi}{2} \), replace \( \theta \) with \( \pi - \theta \) and check if the equation remains unchanged. Substitute \( \pi - \theta \) into the equation: \( r = 2 + \cos(\pi - \theta) \). Use the identity \( \cos(\pi - \theta) = -\cos \theta \) to rewrite it as \( r = 2 - \cos \theta \). Since this is not the same as the original equation, the graph is not symmetric about the line \( \theta = \frac{\pi}{2} \).
To test symmetry about the pole (origin), replace \( r \) with \( -r \) and \( \theta \) with \( \theta + \pi \), then check if the equation remains unchanged. Substitute to get \( -r = 2 + \cos(\theta + \pi) \). Using \( \cos(\theta + \pi) = -\cos \theta \), this becomes \( -r = 2 - \cos \theta \), or equivalently \( r = -2 + \cos \theta \). Since this differs from the original equation, the graph is not symmetric about the pole.
After determining the symmetries, sketch the graph by plotting points for various values of \( \theta \) between 0 and \( 2\pi \), calculating \( r = 2 + \cos \theta \) for each, and then plotting these points in polar coordinates. Connect the points smoothly to visualize the curve.

Verified video answer for a similar problem:
This video solution was recommended by our tutors as helpful for the problem above.
Video duration:
6mWas this helpful?
Key Concepts
Here are the essential concepts you must grasp in order to answer the question correctly.
Polar Coordinates and Equations
Polar coordinates represent points using a radius r and an angle θ from the positive x-axis. Polar equations express r as a function of θ, describing curves in the plane. Understanding how to interpret and plot these equations is essential for graphing polar curves.
Recommended video:
Intro to Polar Coordinates
Symmetry Tests in Polar Graphs
Symmetry in polar graphs can be tested about the polar axis, the line θ = π/2, and the pole (origin). These tests involve substituting θ with -θ, π - θ, or replacing r with -r to check if the equation remains unchanged, helping to simplify graphing and understand the curve's shape.
Recommended video:
Cardioids
Graphing Polar Equations Involving Cosine
Polar equations with cosine terms, like r = 2 + cos θ, often produce limaçon shapes. Recognizing how the cosine function affects the radius for different θ values aids in plotting key points and sketching the curve accurately, including identifying loops or dimpled features.
Recommended video:
Introduction to Common Polar Equations
Related Practice
Textbook Question
4
views
Textbook Question
In Exercises 11–26, plot each complex number. Then write the complex number in polar form. You may express the argument in degrees or radians. −3
2
views
Textbook Question
In Exercises 19–21, find the product of the complex numbers. Leave answers in polar form.
z₁ = 3(cos 40°+i sin 40°)
z₂ = 5(cos 70°+i sin 70°)
4
views
Textbook Question
In Exercises 11–20, use a polar coordinate system like the one shown for Exercises 1–10 to plot each point with the given polar coordinates. (−1, π)
Textbook Question
In Exercises 9–20, use point plotting to graph the plane curve described by the given parametric equations. Use arrows to show the orientation of the curve corresponding to increasing values of t. x = 2t, y = |t − 1|; −∞ < t < ∞
Textbook Question
In Exercises 9–20, find each product and write the result in standard form. (2 + 3i)²