Textbook Question
Solve the right triangle shown in the figure. Round lengths to two decimal places and express angles to the nearest tenth of a degree. A = 52.6°, c = 54
2
views

 Verified step by step guidance
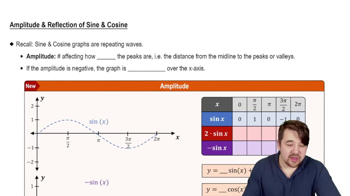
 5:05
5:05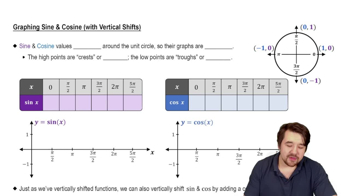 5:53
5:53 6:02
6:02Solve the right triangle shown in the figure. Round lengths to two decimal places and express angles to the nearest tenth of a degree. A = 52.6°, c = 54
The graph of a tangent function is given. Select the equation for each graph from the following options: y = tan(x + π/2), y = tan(x + π), y = -tan x, y = −tan(x − π/2).
Solve the right triangle shown in the figure. Round lengths to two decimal places and express angles to the nearest tenth of a degree. B = 16.8°, b = 30.5
Graph one period of each function. y = 2 tan x/2
Determine the amplitude and period of each function. Then graph one period of the function. y = (1/2) sin (π/3) x
Determine the amplitude of each function. Then graph the function and y = sin x in the same rectangular coordinate system for 0 ≤ x ≤ 2π. y = -3 sin x