In Exercises 9–20, use point plotting to graph the plane curve described by the given parametric equations. Use arrows to show the orientation of the curve corresponding to increasing values of t. x = 2t, y = |t − 1|; −∞ < t < ∞
Table of contents
- 0. Review of College Algebra4h 43m
- 1. Measuring Angles40m
- 2. Trigonometric Functions on Right Triangles2h 5m
- 3. Unit Circle1h 19m
- 4. Graphing Trigonometric Functions1h 19m
- 5. Inverse Trigonometric Functions and Basic Trigonometric Equations1h 41m
- 6. Trigonometric Identities and More Equations2h 34m
- 7. Non-Right Triangles1h 38m
- 8. Vectors2h 25m
- 9. Polar Equations2h 5m
- 10. Parametric Equations1h 6m
- 11. Graphing Complex Numbers1h 7m
- OLD 1. Angles and the Trigonometric Functions Coming soon
- OLD 2. Trigonometric Functions graphs, Inverse Trigonometric Functions Coming soon
- OLD 3. Trigonometric Identities and Equations Coming soon
- OLD 4. Laws of Sines, Cosines and Vectors Coming soon
- OLD 5. Complex Numbers, Polar Coordinates and Parametric Equations Coming soon
- NEW (not used) 7. Laws of Sines, Cosines and Vectors Coming soon
- NEW (not used) 8. Vectors Coming soon
- NEW(not used) 9. Polar equations Coming soon
- NEW (not used) 11. Graphing Complex Numbers Coming soon
9. Polar Equations
Polar Coordinate System
Multiple Choice
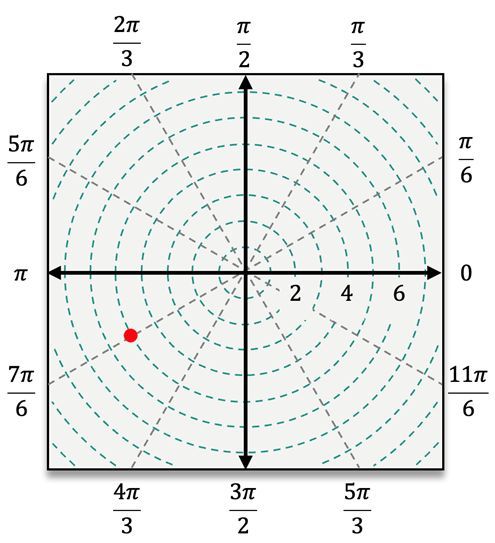
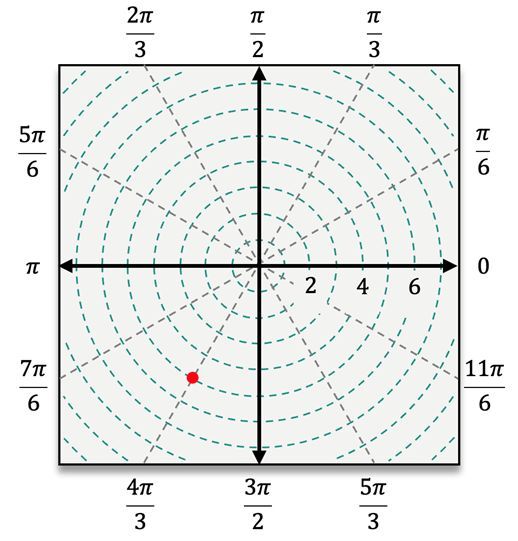
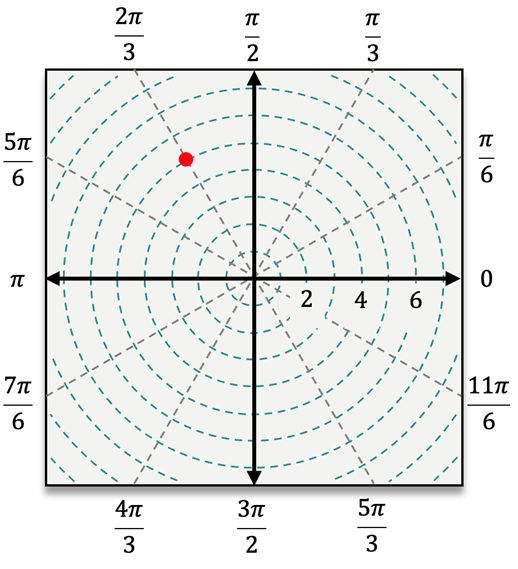
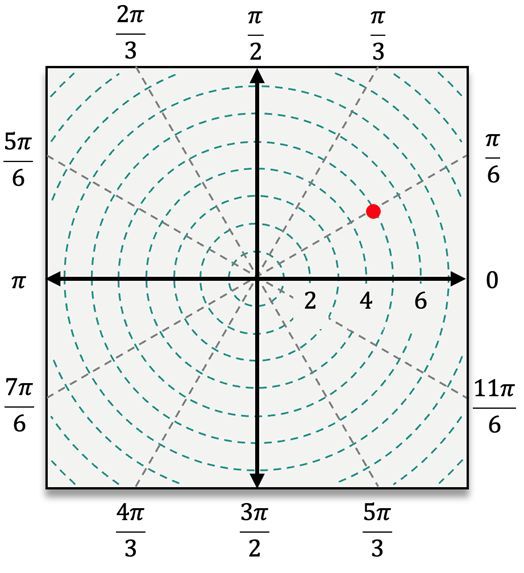
Plot the point on the polar coordinate system.
(5,210°)
A
B
C
D
0 Comments
Verified step by step guidance1
Identify the polar coordinates given: (5, 210°). This means the point is 5 units away from the origin at an angle of 210° from the positive x-axis.
Convert the angle from degrees to radians if necessary. Since 210° is a common angle, it can be converted to radians as 210° = \( \frac{7\pi}{6} \) radians.
Locate the angle \( \frac{7\pi}{6} \) on the polar coordinate system. This angle is in the third quadrant, as it is more than \( \pi \) (180°) but less than \( \frac{3\pi}{2} \) (270°).
From the origin, measure a distance of 5 units along the direction of the angle \( \frac{7\pi}{6} \).
Plot the point at this location. The correct plot should be in the third quadrant, 5 units from the origin, along the line corresponding to \( \frac{7\pi}{6} \).
Related Videos
Related Practice
Textbook Question

