


 06:33
06:33

Textbook Question
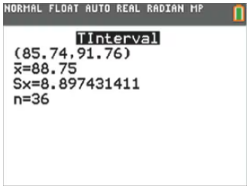
In Exercises 1–4, refer to the accompanying screen display that results from a simple random sample of times (minutes) between eruptions of the Old Faithful geyser. The confidence level of 95% was used.
Degrees of Freedom
a. What is the number of degrees of freedom that should be used for finding the critical value ta/2?