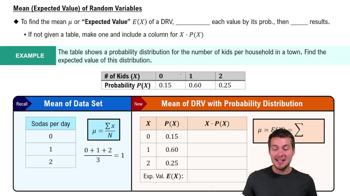
Ch. 5 - Discrete Probability Distributions
Triola - Elementary Statistics 14th Edition
Triola14th EditionElementary StatisticsISBN: 9780137366446Not the one you use?Change textbook
Chapter 5, Problem 5.1.30e

Expected Value in North Carolina’s Pick 4 Game In North Carolina’s Pick 4 lottery game, you can pay \(1 to select a four-digit number from 0000 through 9999. If you select the same sequence of four digits that are drawn, you win and collect \)5000.


e. If you bet \$1 in North Carolina’s Pick 3 game, the expected value is Which bet is better in the sense of a producing a higher expected value: A \$1 bet in the North Carolina Pick 4 game or a \$1 bet in the North Carolina Pick 3 game?

Verified step by step guidance
1
Step 1: Understand the concept of expected value. Expected value (EV) is a measure of the average outcome of a random event over the long run. It is calculated as the sum of all possible outcomes, each weighted by its probability of occurrence. The formula is: EV = Σ (Probability of outcome × Value of outcome).
Step 2: Calculate the probability of winning in the Pick 4 game. Since there are 10,000 possible four-digit combinations (0000 to 9999), the probability of selecting the correct sequence is 1/10,000.
Step 3: Determine the expected value for the Pick 4 game. The payout for winning is \$5000, and the cost of the ticket is \(1. The expected value is calculated as: EV = (Probability of winning × Payout) + (Probability of losing × Loss). Substitute the values: EV = (1/10,000 × \)5000) + (9,999/10,000 × -\$1).
Step 4: Compare this to the expected value of the Pick 3 game. If the expected value for the Pick 3 game is already provided, use it directly for comparison. If not, calculate it using the same formula as in Step 3, but adjust for the probabilities and payouts specific to the Pick 3 game (e.g., 1/1000 probability of winning if there are 1000 possible combinations).
Step 5: Compare the two expected values. The game with the higher expected value is the better bet in terms of producing a higher average return over the long run. Note that both games may have negative expected values, meaning they are not favorable bets overall, but the comparison will identify the less unfavorable option.

Verified video answer for a similar problem:

This video solution was recommended by our tutors as helpful for the problem above.
Video duration:
4m
Was this helpful?

Key Concepts

Here are the essential concepts you must grasp in order to answer the question correctly.

Expected Value

Expected value is a fundamental concept in probability and statistics that represents the average outcome of a random event when repeated many times. It is calculated by multiplying each possible outcome by its probability and summing these products. In the context of gambling or lotteries, it helps determine the average return on a bet, guiding players in making informed decisions.
Recommended video:
Guided course
04:14
Expected Value (Mean) of Random Variables

Probability

Probability is a measure of the likelihood that a particular event will occur, expressed as a number between 0 and 1. In lottery games, the probability of winning is determined by the number of successful outcomes (e.g., matching the drawn number) divided by the total number of possible outcomes. Understanding probability is crucial for calculating expected value and comparing different betting options.
Recommended video:
5:37
Introduction to Probability

Comparative Analysis

Comparative analysis involves evaluating two or more options to determine which is more favorable based on specific criteria, such as expected value in this case. By comparing the expected values of different bets, players can identify which option offers a better return on investment. This concept is essential for making strategic decisions in games of chance like lotteries.
Recommended video:
Guided course
04:48
Comparing Mean vs. Median
Related Practice
Textbook Question

In Exercises 6–10, refer to the accompanying table, which describes the numbers of adults in groups of five who reported sleepwalking (based on data from “Prevalence and Comorbidity of Nocturnal Wandering In the U.S. Adult General Population,” by Ohayon et al., Neurology, Vol. 78, No. 20).


Probability Find the probability that at least one of the subjects is a sleepwalker.

Textbook Question

In Exercises 25–28, find the probabilities and answer the questions.


Too Young to Tat Based on a Harris poll, among adults who regret getting tattoos, 20% say that they were too young when they got their tattoos. Assume that five adults who regret getting tattoos are randomly selected, and find the indicated probability.


d. If we randomly select five adults, is 1 a significantly low number who say that they were too young to get tattoos?

1
views
Textbook Question

Politics The County Clerk in Essex, New Jersey, was accused of cheating by not using randomness in assigning the order in which candidates’ names appeared on voting ballots. Among 41 different ballots, Democrats were assigned the desirable first line 40 times. Assume that Democrats and Republicans are assigned the first line using a method of random selection so that they are equally likely to get that first line.


e. What do the results suggest about how the clerk met the requirement of using a random method to assign the order of candidates’ names on voting ballots?

1
views
Textbook Question

Using Probabilities for Significant Events


d. Is 1 a significantly low number of matches? Why or why not?

Textbook Question

Expected Value for the Florida Pick 3 Lottery In the Florida Pick 3 lottery, you can bet \$1 by selecting three digits, each between 0 and 9 inclusive. If the same three numbers are drawn in the same order, you win and collect \(500.


d. Find the expected value for a \)1 bet.

1
views
Textbook Question

In Exercises 6–10, refer to the accompanying table, which describes the numbers of adults in groups of five who reported sleepwalking (based on data from “Prevalence and Comorbidity of Nocturnal Wandering In the U.S. Adult General Population,” by Ohayon et al., Neurology, Vol. 78, No. 20).


Does the table describe a probability distribution?