Ch. 3 - Describing, Exploring, and Comparing Data
Triola - Elementary Statistics 14th Edition
Triola14th EditionElementary StatisticsISBN: 9780137366446Not the one you use?Change textbook
Chapter 3, Problem 3.3.17

Percentiles. In Exercises 17–20, use the following radiation levels (in W/kg) for 50 different cell phones. Find the percentile corresponding to the given radiation level.


0.48 W/kg

Verified step by step guidance
1
Step 1: Arrange the given radiation levels in ascending order. This step is already completed as the data provided is sorted.
Step 2: Identify the position of the given radiation level (0.48 W/kg) in the sorted list. Count the number of values less than or equal to 0.48.
Step 3: Use the formula for calculating the percentile: \( P = \frac{k}{n} \times 100 \), where \( k \) is the number of values less than or equal to the given value, and \( n \) is the total number of values in the dataset.
Step 4: Substitute \( k \) (the count from Step 2) and \( n \) (the total number of values, which is 50) into the formula.
Step 5: Simplify the formula to find the percentile corresponding to the radiation level of 0.48 W/kg.

Verified video answer for a similar problem:

This video solution was recommended by our tutors as helpful for the problem above.
Video duration:
2m
Was this helpful?

Key Concepts

Here are the essential concepts you must grasp in order to answer the question correctly.

Percentiles

A percentile is a statistical measure that indicates the value below which a given percentage of observations in a group falls. For example, the 50th percentile (median) is the value that separates the higher half from the lower half of the data set. Understanding percentiles helps in interpreting data distributions and comparing individual scores to a larger dataset.

Data Distribution

Data distribution refers to the way in which data points are spread or arranged across different values. It can be visualized using histograms or box plots, and it helps in understanding the central tendency, variability, and overall shape of the data. Recognizing the distribution is crucial for accurately calculating percentiles and making statistical inferences.
Recommended video:
Guided course
04:39
Visualizing Qualitative vs. Quantitative Data

Interpreting Radiation Levels

In the context of this question, interpreting radiation levels involves understanding the significance of the measured values (in W/kg) and their implications for health and safety. Knowing how to analyze these levels in relation to percentiles allows for assessing how a specific phone's radiation compares to others, which is essential for making informed decisions regarding exposure.
Recommended video:
06:33
Introduction to Confidence Intervals
Related Practice
Textbook Question

Boxplots from Large Data Sets in Appendix B. In Exercises 33–36, use the given data sets in Appendix B. Use the boxplots to compare the two data sets.


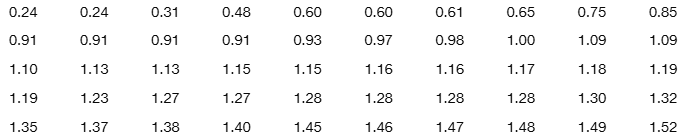
Pulse Rates Use the same scale to construct boxplots for the pulse rates of males and females from Data Set 1 “Body Data” in Appendix B.

1
views
Textbook Question

What’s Wrong? Education Week magazine published a list consisting of the mean teacher salary in each of the 50 states for a recent year. If we add the 50 means and then divide by 50, we get \$56,479. Is the value of \$56,479 the mean teacher salary for the population of all teachers in the 50 United States? Why or why not?

Textbook Question

Geometric Mean The geometric mean is often used in business and economics for finding average rates of change, average rates of growth, or average ratios. To find the geometric mean of n values (all of which are positive), first multiply the values, then find the nth root of the product. For a 6-year period, money deposited in annual certificates of deposit had annual interest rates of 0.58%, 0.29%, 0.13%, 0.14%, 0.15%, and 0.19%. Identify the single percentage growth rate that is the same as the six consecutive growth rates by computing the geometric mean of 1.0058, 1.0029, 1.0013, 1.0014, 1.0015, and 1.0019.

Textbook Question

Identifying Significant Values with the Range Rule of Thumb. In Exercises 33–36, use the range rule of thumb to identify the limits separating values that are significantly low or significantly high.


U.S. Presidents Based on Data Set 22 “Presidents” in Appendix B, at the time of their first inauguration, presidents have a mean age of 55.2 years and a standard deviation of 6.9 years. Is the minimum required 35-year age for a president significantly low?

2
views
Textbook Question

The Empirical Rule Based on Data Set 1 “Body Data” in Appendix B, blood platelet counts of women have a bell-shaped distribution with a mean of 255.1 and a standard deviation of 65.4. (All units are 1000 cells/) Using the empirical rule, what is the approximate percentage of women with platelet counts


a. within 2 standard deviations of the mean, or between 124.3 and 385.9?

Textbook Question

Identifying Significant Values with the Range Rule of Thumb. In Exercises 33–36, use the range rule of thumb to identify the limits separating values that are significantly low or significantly high.


Foot Lengths Based on Data Set 9 “Foot and Height” in Appendix B, adult males have foot lengths with a mean of 27.32 cm and a standard deviation of 1.29 cm. Is the adult male foot length of 30 cm significantly low, significantly high, or neither? Explain.