Ch. 3 - Describing, Exploring, and Comparing Data
Triola - Elementary Statistics 14th Edition
Triola14th EditionElementary StatisticsISBN: 9780137366446Not the one you use?Change textbook
Chapter 3, Problem 3.3.22

In Exercises 21–28, use the same list of cell phone radiation levels given for Exercises 17–20. Find the indicated percentile or quartile.


Q1


Verified step by step guidance
1
Step 1: Understand the problem. The goal is to find Q1, the first quartile, which represents the 25th percentile of the data. This means identifying the value below which 25% of the data falls.
Step 2: Organize the data. The provided list of cell phone radiation levels is already sorted in ascending order, which is necessary for calculating quartiles.
Step 3: Determine the position of Q1 in the sorted data. Use the formula for the position of a quartile: P = (n + 1) * (percentile / 100), where n is the total number of data points. For Q1, the percentile is 25%.
Step 4: Calculate the position using the formula. Substitute the total number of data points (n) into the formula to find the position of Q1. If the position is not an integer, interpolate between the two closest data points.
Step 5: Identify the value corresponding to the calculated position in the sorted data. This value is Q1, the first quartile.

Verified video answer for a similar problem:

This video solution was recommended by our tutors as helpful for the problem above.
Video duration:
2m
Was this helpful?

Key Concepts

Here are the essential concepts you must grasp in order to answer the question correctly.

Percentiles

Percentiles are measures that indicate the relative standing of a value within a dataset. Specifically, the nth percentile is the value below which n percent of the data falls. For example, the 25th percentile (Q1) is the value below which 25% of the observations lie, helping to understand the distribution of data points.

Quartiles

Quartiles are specific percentiles that divide a dataset into four equal parts. The first quartile (Q1) represents the 25th percentile, the second quartile (Q2) is the median or 50th percentile, and the third quartile (Q3) is the 75th percentile. Quartiles are useful for summarizing data and identifying the spread and center of a dataset.
Recommended video:
Guided course
04:51
Find 5-Number Summary - TI-84 Calculator

Data Distribution

Data distribution refers to how values are spread or arranged in a dataset. Understanding the distribution is crucial for interpreting percentiles and quartiles, as it affects the calculation of these measures. A dataset can be normally distributed, skewed, or uniform, which influences the interpretation of statistical measures and the overall analysis.
Recommended video:
Guided course
04:39
Visualizing Qualitative vs. Quantitative Data
Related Practice
Textbook Question

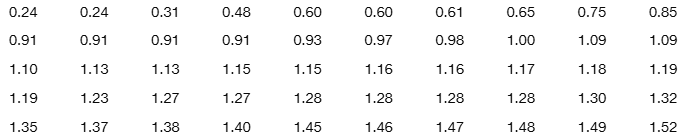
Large Data Sets from Appendix B. In Exercises 25–28, refer to the indicated data set in Appendix B. Use software or a calculator to find the means and medians.


Body Temperatures Refer to Data Set 5 “Body Temperatures” in Appendix B and use the body temperatures for 12:00 AM on day 2. Do the results support or contradict the common belief that the mean body temperature is 98.6oF?

1
views
Textbook Question

In Exercises 5–20, find the range, variance, and standard deviation for the given sample data. Include appropriate units (such as “minutes”) in your results. (The same data were used in Section 3-1, where we found measures of center. Here we find measures of variation.) Then answer the given questions.


Jaws 3 Listed below are the number of unprovoked shark attacks worldwide for the last several years. What extremely important characteristic of the data is not considered when finding the measures of variation?


70 54 68 82 79 83 76 73 98 81

Textbook Question

Quadratic Mean The quadratic mean (or root mean square, or R.M.S.) is used in physical applications, such as power distribution systems. The quadratic mean of a set of values is obtained by squaring each value, adding those squares, dividing the sum by the number of values n, and then taking the square root of that result, as indicated below:


Quadratic mean = sqrt(∑x^2/n)


Find the R.M.S. of these voltages measured from household current: 0, 60, 110, 0. How does the result compare to the mean?

Textbook Question

Mean Absolute Deviation Use the same population of {9 cigarettes, 10 cigarettes, 20 cigarettes} from Exercise 45. Show that when samples of size 2 are randomly selected with replacement, the samples have mean absolute deviations that do not center about the value of the mean absolute deviation of the population. What does this indicate about a sample mean absolute deviation being used as an estimator of the mean absolute deviation of a population?

Textbook Question

Why Divide by ? Let a population consist of the values 9 cigarettes, 10 cigarettes, and 20 cigarettes smoked in a day (based on data from the California Health Interview Survey). Assume that samples of two values are randomly selected with replacement from this population. (That is, a selected value is replaced before the second selection is made.)


a. Find the variance of the population {9 cigarettes, 10 cigarettes, 20 cigarettes}.

Textbook Question

In Exercises 5–20, find the range, variance, and standard deviation for the given sample data. Include appropriate units (such as “minutes”) in your results. (The same data were used in Section 3-1, where we found measures of center. Here we find measures of variation.) Then answer the given questions.


Super Bowl Ages Listed below are the ages of the same 11 players used in the preceding exercise. How are the resulting statistics fundamentally different from those found in the preceding exercise?


41 24 30 31 32 29 25 26 26 25 30