

 04:51
04:51
Textbook Question
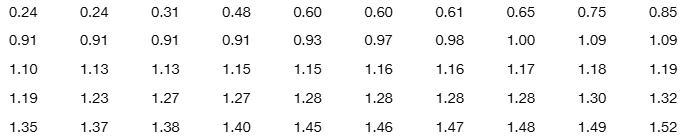
In Exercises 21–24, find the mean and median for each of the two samples, then compare the two sets of results.
It’s a Small Wait After All Listed below are the wait times (minutes) at 10 AM for the rides “It’s a Small World” and “Avatar Flight of Passage.” These data are found in Data Set 33 “Disney World Wait Times.” Does a comparison between the means and medians reveal that there is a difference between the two sets of data?