Textbook Question
Interpreting Normal Quantile Plots Which of the following normal quantile plots appear to represent data from a population having a normal distribution? Explain.

 Verified step by step guidance
 05:18
05:18 06:38
06:38 04:39
04:39Interpreting Normal Quantile Plots Which of the following normal quantile plots appear to represent data from a population having a normal distribution? Explain.
In Exercises 21–24, find the coefficient of variation for each of the two samples; then compare the variation. (The same data were used in Section 3-1.)
Pulse Rates Listed below are pulse rates (beats per minute) from samples of adult males and females (from Data Set 1 “Body Data” in Appendix B). Does there appear to be a difference?
[IMAGE]
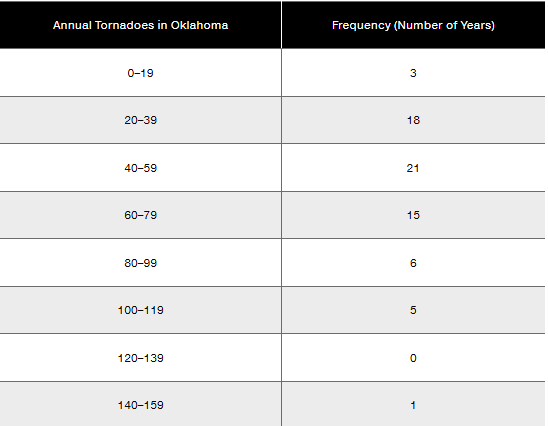
Tornado Alley Using the same frequency distribution from Exercise 1, identify the class limits of the first class and the class boundaries of the first class.
Histogram of Interarrival Times Construct the histogram that corresponds to the frequency distribution from Exercise 1. Use class midpoint values for the horizontal scale. Does the histogram suggest that the data are from a population having a normal distribution? Why or why not?
Tornado Alley Construct the relative frequency distribution corresponding to the frequency distribution in Exercise 1