Ch. 12 - Analysis of Variance
Triola - Elementary Statistics 14th Edition
Triola14th EditionElementary StatisticsISBN: 9780137366446Not the one you use?Change textbook
Chapter 12, Problem 12.2.9

Sitting Heights The sitting height of a person is the vertical distance between the sitting surface and the top of the head. The following table lists sitting heights (mm) of randomly selected U.S. Army personnel collected as part of the ANSUR II study. Using the data with a 0.05 significance level, what do you conclude? Are the results as you would expect?
Table of sitting heights (mm) for U.S. Army personnel by gender and handedness.

Verified step by step guidance
1
Step 1: Organize the data into two groups based on handedness (Right-Handed and Left-Handed) and gender (Female and Male). Calculate the mean sitting height for each group to summarize the data.
Step 2: Perform a hypothesis test to determine if there is a significant difference in sitting heights between Right-Handed and Left-Handed individuals. Set up the null hypothesis (H₀: There is no difference in sitting heights) and the alternative hypothesis (H₁: There is a difference in sitting heights).
Step 3: Choose an appropriate statistical test, such as a two-sample t-test, to compare the means of the two groups. Ensure assumptions like normality and equal variances are checked before proceeding.
Step 4: Calculate the test statistic and p-value using the data provided. Use the significance level of 0.05 to determine whether to reject or fail to reject the null hypothesis.
Step 5: Interpret the results of the hypothesis test. If the p-value is less than 0.05, conclude that there is a significant difference in sitting heights between the groups. Discuss whether the results align with expectations based on the context of the study.

Verified video answer for a similar problem:

This video solution was recommended by our tutors as helpful for the problem above.
Video duration:
3m
Was this helpful?

Key Concepts

Here are the essential concepts you must grasp in order to answer the question correctly.

Sitting Height Measurement

Sitting height is defined as the vertical distance from the sitting surface to the top of the head. It is an important anthropometric measurement used in various fields, including ergonomics and health assessments, to understand body proportions and design suitable environments. In this context, the sitting heights of U.S. Army personnel are analyzed to draw conclusions about differences based on gender and handedness.
Recommended video:
Guided course
05:53
Parameters vs. Statistics

Statistical Significance

Statistical significance is a determination of whether the observed results in a study are likely due to chance or if they reflect a true effect. In hypothesis testing, a significance level (commonly set at 0.05) is used to decide whether to reject the null hypothesis. In this case, it will help assess whether the differences in sitting heights among groups are statistically meaningful.
Recommended video:
Guided course
05:53
Parameters vs. Statistics

Comparative Analysis

Comparative analysis involves evaluating two or more groups to identify differences or similarities in their characteristics. In this scenario, the sitting heights of right-handed and left-handed individuals across genders are compared. This analysis can reveal insights into how factors like gender and handedness may influence physical measurements, contributing to broader understanding in anthropometry.
Recommended video:
Guided course
04:48
Comparing Mean vs. Median
Related Practice
Textbook Question

In Exercises 5–16, use analysis of variance for the indicated test.


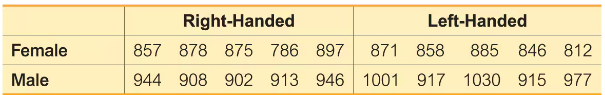
Clancy, Rowling, and Tolstoy Ease of Reading Pages were randomly selected from three books: The Bear and the Dragon by Tom Clancy, Harry Potter and the Sorcerer’s Stone by J.K. Rowling, and War and Peace by Leo Tolstoy. Listed below are Flesch Reading Ease Scores for those pages. Use a 0.05 significance level to test the claim that pages from books by those three authors have the same mean Flesch Reading Ease score. Given that higher scores correspond to text that is easier to read, which author appears to be different, and how is that author different?


Textbook Question

In Exercises 1–4, use the following listed measured amounts of chest compression (mm) from car crash tests (from Data Set 35 “Car Data” in Appendix B). Also shown are the SPSS results from analysis of variance. Assume that we plan to use a 0.05 significance level to test the claim that the different car sizes have the same mean amount of chest compression.

P-VALUE If we use a 0.05 significance level in analysis of variance with the sample data given in Exercise 1, what is the P-value? What should we conclude? If the four populations have means that do not appear to be the same, does the analysis of variance test enable us to identify which populations have means that are significantly different?

1
views
Textbook Question

In Exercises 5–16, use analysis of variance for the indicated test.


Triathlon Times Jeff Parent is a statistics instructor who participates in triathlons. Listed below are times (in minutes and seconds) he recorded while riding a bicycle for five stages through each mile of a 3-mile loop. Use a 0.05 significance level to test the claim that it takes the same time to ride each of the miles. Does one of the miles appear to have a hill?

Textbook Question

Two-Way Anova If we have a goal of using the data given in Exercise 1 to (1) determine whether the femur side (left, right) has an effect on the crash force measurements and (2) to determine whether the vehicle size has an effect on the crash force measurements, should we use one-way analysis of variance for the two individual tests? Why or why not?

Textbook Question

Balanced Design Does the table given in Exercise 1 constitute a balanced design? Why or why not?

Textbook Question

One-Way ANOVA In general, what is one-way analysis of variance used for?