Ch. 11 - Goodness-of-Fit and Contingency Tables
Triola - Elementary Statistics 14th Edition
Triola14th EditionElementary StatisticsISBN: 9780137366446Not the one you use?Change textbook
Chapter 11, Problem 11.2.13

Gender and Eye Color The following table describes the distribution of eye colors reported by male and female statistics students (based on data from “Does Eye Color Depend on Gender? It Might Depend on Who or How You Ask,” by Froelich and Stephenson, Journal of Statistics Education, Vol. 21, No. 2). Is there sufficient evidence to warrant rejection of the belief that gender and eye color are independent traits? Use a 0.01 significance level.


Verified step by step guidance
1
Step 1: Define the null and alternative hypotheses. The null hypothesis (H₀) states that gender and eye color are independent traits. The alternative hypothesis (H₁) states that gender and eye color are not independent traits.
Step 2: Organize the data into a contingency table. The table provided already shows the observed frequencies for each combination of gender and eye color. Calculate the row totals, column totals, and the grand total (sum of all frequencies).
Step 3: Compute the expected frequencies for each cell in the table using the formula: E = (row total × column total) / grand total. This represents the frequency we would expect if gender and eye color were independent.
Step 4: Calculate the chi-square test statistic using the formula: χ² = Σ((O - E)² / E), where O represents the observed frequency and E represents the expected frequency for each cell. Sum this value across all cells in the table.
Step 5: Compare the calculated χ² value to the critical value from the chi-square distribution table at the 0.01 significance level with the appropriate degrees of freedom (df = (number of rows - 1) × (number of columns - 1)). If χ² exceeds the critical value, reject the null hypothesis; otherwise, fail to reject the null hypothesis.

Verified video answer for a similar problem:

This video solution was recommended by our tutors as helpful for the problem above.
Video duration:
6m
Was this helpful?

Key Concepts

Here are the essential concepts you must grasp in order to answer the question correctly.

Chi-Square Test of Independence

The Chi-Square Test of Independence is a statistical method used to determine if there is a significant association between two categorical variables. In this context, it assesses whether gender and eye color are independent traits. The test compares the observed frequencies in each category to the expected frequencies if the two variables were independent, allowing researchers to evaluate the null hypothesis.
Recommended video:
05:54
Probability of Multiple Independent Events

Significance Level

The significance level, often denoted as alpha (α), is the threshold for determining whether to reject the null hypothesis in hypothesis testing. A significance level of 0.01 indicates a 1% risk of concluding that a relationship exists when there is none. This stringent criterion is used to minimize the likelihood of Type I errors, which occur when a true null hypothesis is incorrectly rejected.
Recommended video:
Guided course
04:46
Step 4: State Conclusion Example 4

Contingency Table

A contingency table is a matrix that displays the frequency distribution of variables, allowing for the examination of the relationship between them. In this case, the table shows the counts of different eye colors for male and female statistics students. Analyzing this table is essential for performing the Chi-Square Test of Independence, as it provides the necessary data to calculate observed and expected frequencies.
Recommended video:
Guided course
09:47
Finding Standard Normal Probabilities using z-Table
Related Practice
Textbook Question

Right-Tailed, Left-Tailed, Two-Tailed Is the hypothesis test described in Exercise 1 right-tailed, left-tailed, or two-tailed? Explain your choice.

Textbook Question

Clinical Trial of Echinacea In a clinical trial of the effectiveness of echinacea for preventing colds, the results in the table below were obtained (based on data from “An Evaluation of Echinacea Angustifolia in Experimental Rhinovirus Infections,” by Turner et al., New England Journal of Medicine, Vol. 353, No. 4). Use a 0.05 significance level to test the claim that getting a cold is independent of the treatment group. What do the results suggest about the effectiveness of echinacea as a prevention against colds?

Textbook Question

In Exercises 5–20, conduct the hypothesis test and provide the test statistic and the P-value and/or critical value, and state the conclusion.


Flat Tire and Missed Class A classic story involves four carpooling students who missed a test and gave as an excuse a flat tire. On the makeup test, the instructor asked the students to identify the particular tire that went flat. If they really didn’t have a flat tire, would they be able to identify the same tire? The author asked 41 other students to identify the tire they would select. The results are listed in the following table (except for one student who selected the spare). Use a 0.05 significance level to test the author’s claim that the results fit a uniform distribution. What does the result suggest about the likelihood of four students identifying the same tire when they really didn’t have a flat?


" style="" width="600">

Textbook Question

Accuracy of Fingerprint Identifications An experiment was conducted to compare the accuracy of fingerprint experts to the accuracy of novices (based on data from “Identifying Fingerprint Expertise,” by Tangen, Thompson, and McCarthy, Psychological Science, Vol. 22, No. 8). The data in the table are based on trials in which the evaluators were given matching fingerprints. Use a 0.05 significance level to determine whether correct identification is independent of whether the evaluator is an expert or a novice.


Textbook Question

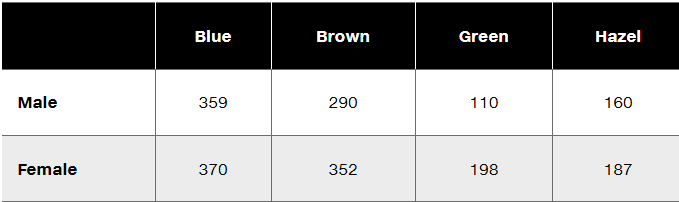
Ghosts The following table summarizes results from a Pew Research Center survey in which subjects were asked whether they had seen or been in the presence of a ghost. Use a 0.01 significance level to test the claim that gender is independent of response. Does the conclusion change if the significance level is changed to 0.05?


Textbook Question

In Exercises 5–20, conduct the hypothesis test and provide the test statistic and the P-value and/or critical value, and state the conclusion.


Heights Measured or Reported? A random sample of the last digits of heights (in.) of males from Data Set 4 “Measured and Reported” is summarized in the table below. Use these last digits to determine whether they occur with about the same frequency. Use a 0.05 significance level. Do the corresponding heights appear to be measured or reported?


" style="" width="600">