

 05:17
05:17

Textbook Question
Testing the Difference Between Two Means (e) decide whether to reject or fail to reject the null hypothesis, Assume the samples are random and dependent, and the populations are normally distributed.
[APPLET] Migraines
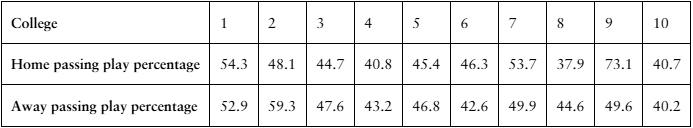
A researcher claims that injections of onabotulinumtoxinA reduce the number of days per month that chronic migraine sufferers have headaches. The table shows the number of days chronic migraine sufferers suffered migraines before and after using the treatment. At , α= 0.01 is there enough evidence to support the researcher’s claim? (Adapted from Journal of Headache and Pain)