Textbook Question
In Exercises 7–10, the statement represents a claim. Write its complement and state which is Ho and which is Ha.
μ≠2.28

 Verified step by step guidance
 05:52
05:52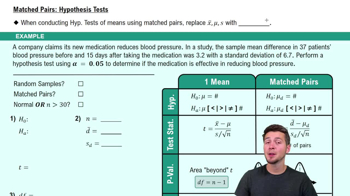 07:23
07:23 03:33
03:33In Exercises 7–10, the statement represents a claim. Write its complement and state which is Ho and which is Ha.
μ≠2.28
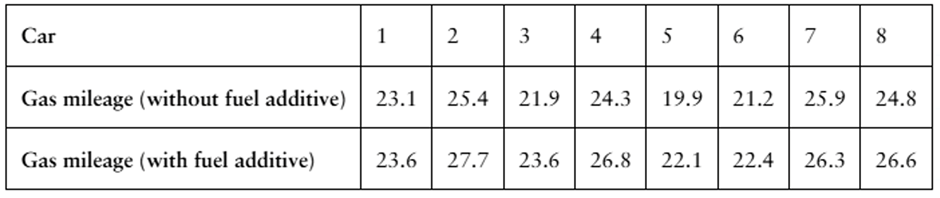
Testing the Difference Between Two Means (a) identify the claim and state Ho and Ha , (b) find the critical value(s) and identify the rejection region(s), (c) calculate d̄ and Sd, (d) find the standardized test statistic t, (e) decide whether to reject or fail to reject the null hypothesis, and (f) interpret the decision in the context of the original claim. Assume the samples are random and dependent, and the populations are normally distributed.
[APPLET] Therapeutic Taping
A physical therapist claims that the use of a specific type of therapeutic tape reduces pain in patients with chronic tennis elbow. The table shows the pain levels on a scale of 0 to 10, where 0 is no pain and 10 is the worst pain possible, for 15 patients with chronic tennis elbow when holding a 1 kilogram weight. At , α=0.05 is there enough evidence to support the therapist’s claim? (Adapted from BioMed Central, Ltd.)
Constructing Confidence Intervals for μ1-μ2, When the sampling distribution for x̅1-x̅2 is approximated by a t-distribution and the population variances are not equal, you can construct a confidence interval for μ1-μ2 , as shown below.
construct the indicated confidence interval for μ1-μ2 . Assume the populations are approximately normal with unequal variances.
10K Race
To compare the mean finishing times of male and female participants in a 10K race, you randomly select several finishing times from both sexes. The results are shown at the left. Construct an 80% confidence interval for the difference in mean finishing times of male and female participants in the race. (Adapted from Great Race)
Test the claim about the mean of the differences for a population of paired data at the level of significance α. Assume the samples are random and dependent, and the populations are normally distributed.
Claim: μd≤0 , α=0.10, Sample statistics: d̄ =6.5, sd=9.54, n=16
A pediatrician claims that the mean birth weight of a single-birth baby is greater than the mean birth weight of a baby that has a twin. The mean birth weight of a random sample of 85 single-birth babies is 3086 grams. Assume the population standard deviation is 563 grams. The mean birth weight of a random sample of 68 babies that have a twin is 2263 grams. Assume the population standard deviation is 624 grams. At α=0.10, can you support the pediatrician’s claim? Interpret the decision in the context of the original claim.
Describe another way you can perform a hypothesis test for the difference between the means of two populations using independent samples with and known that does not use rejection regions.