


 07:01
07:01
Textbook Question
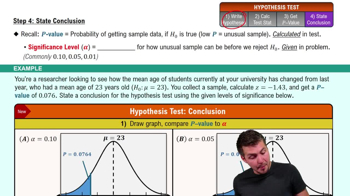
Graphical Analysis In Exercises 57–60, you are given a null hypothesis and three confidence intervals that represent three samplings. Determine whether each confidence interval indicates that you should reject H0. Explain your reasoning.